
How to build a custom report
BeingA written.custom report is a report you build yourself from your sales, labor or ticket data. You choose the numbers to show, how to group them and what to leave out, and see them as a table and a chart. Once it's saved, it works like any other report: you can run it for any dates and locations, favorite it, schedule it, email it and export it. This will walk through building a custom report and saving it.
Permissions you need
- Reporting --> Build Custom Reports, to build reports and save them in My Reports.
- Reporting --> Manage Team Custom Reports, only to save a report in Team Reports, where the rest of your team can see it.
You can build on the same data you can already see in the regular reports. For example, if you can open the Product Mix Report you can build on item sales, and pay and tip numbers need access to the payroll reports.
Starting a new report
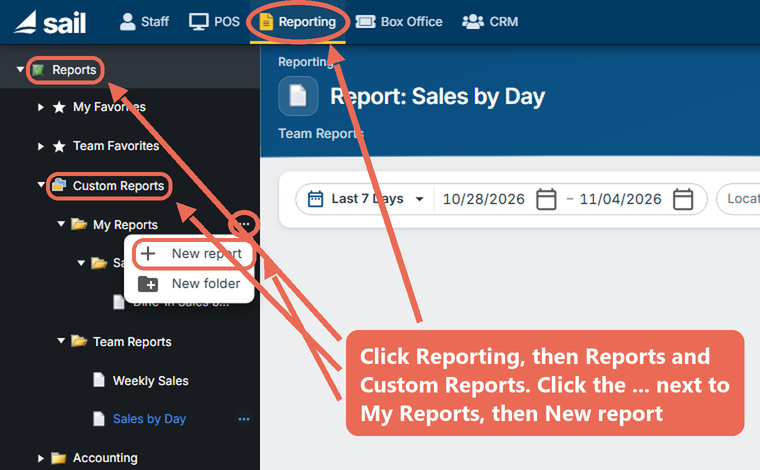
- Click Reporting at the top, then Reports and Custom Reports. Click the ... next to My Reports and click New report.
- Choose what you'd like to report on:
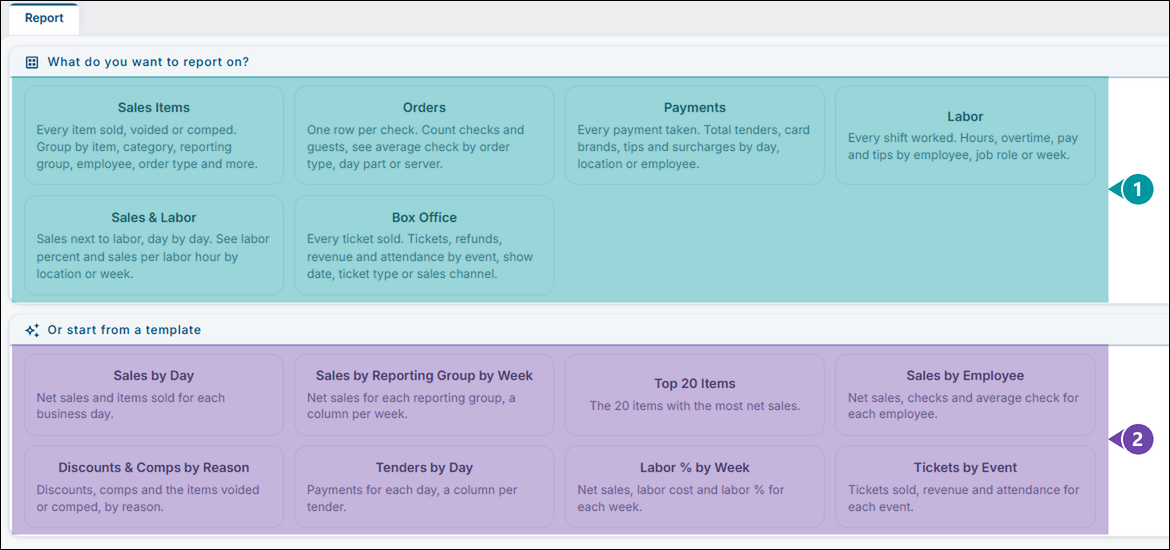
- What do you want to report on?: Pick the kind of data:
- Sales Items: Every item sold, voided or comped. Good for net sales by item, item category, reporting group, employee, order type or day part.
- Orders: One row per check. Good for checks, guests and average check.
- Payments: Every payment taken. Good for tenders, card brands, tips and surcharges.
- Labor: Every shift worked. Good for hours, overtime, pay and tips by employee or job role.
- Sales & Labor: Sales next to labor, day by day. Good for labor percent and sales per labor hour.
- Box Office: Every ticket sold. Good for tickets, refunds, revenue and attendance by event or show date.
- Or start from a template: Pick a ready-made report, such as Sales by Day or Top 20 Items. It opens already filled in, and you can change anything before you save it.
- What do you want to report on?: Pick the kind of data:
Building the report
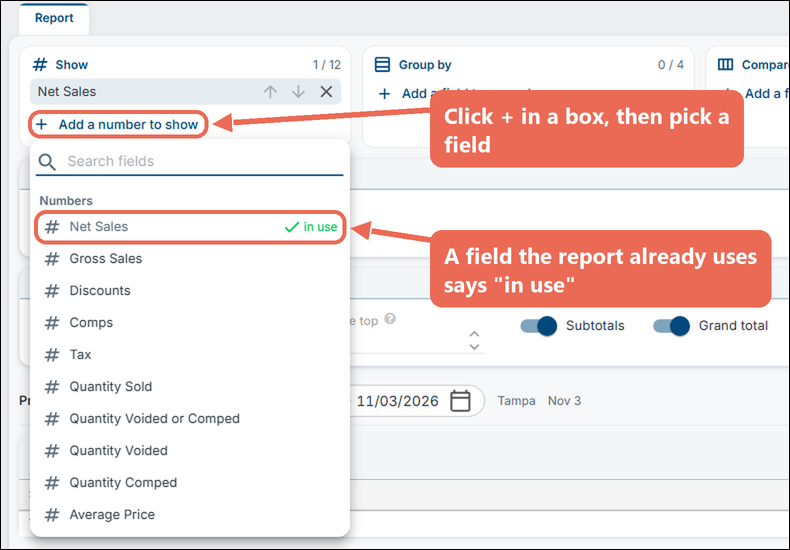
- Click the + in a box and pick a field from the list. A field the report already uses says in use.
- Fill out the report. The preview at the bottom changes as you go:
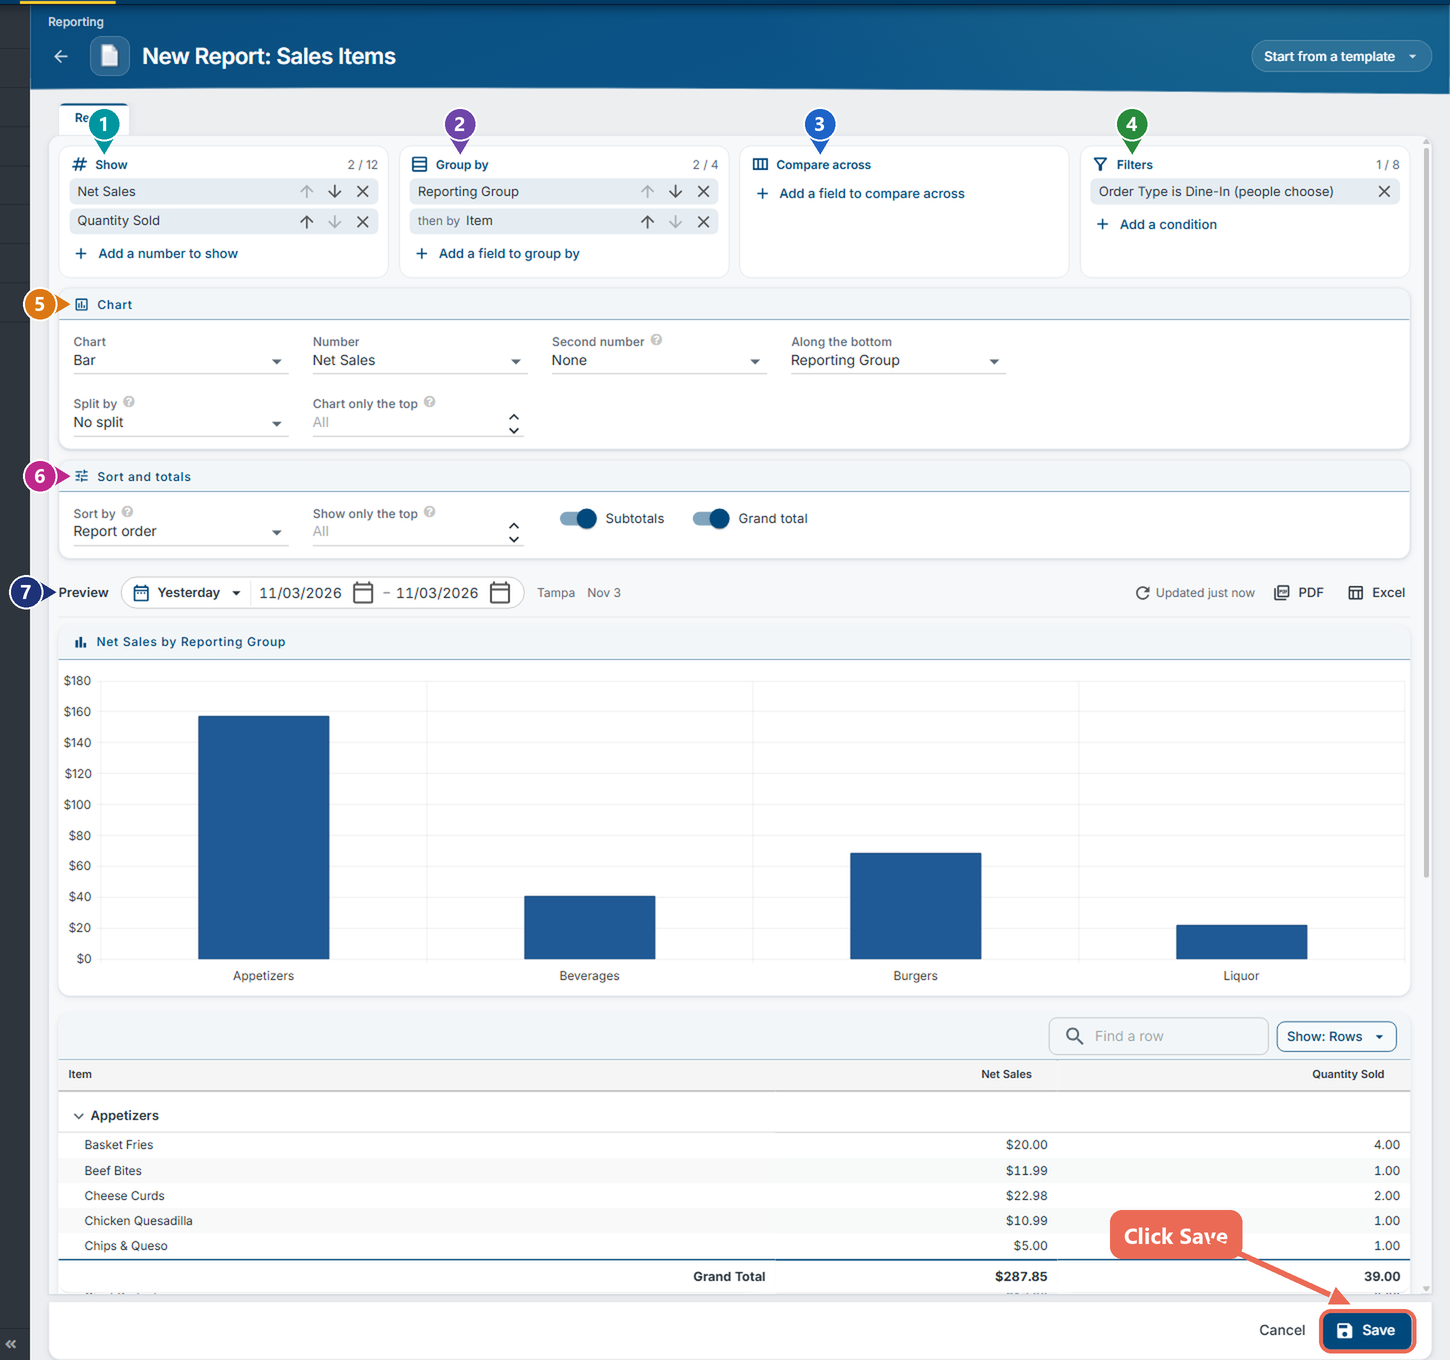
- Show: The numbers in the report, such as Net Sales or Quantity Sold (at least one, up to 12).
- Group by: What each row is, such as Reporting Group. Add another field to group the rows again inside each group ("then by" Item), up to 4.
- Compare across: One field across the top of the report, with a column for each, such as Week or Location (optional).
- Filters: What to keep in or leave out, such as Order Type is Dine-In (optional, up to 8). See Adding a filter below.
- Chart: The kind of chart (bar, line, pie and more), the number it shows and what runs along the bottom. Pick No chart for a table only.
- Sort and totals: How the rows are sorted, Show only the top rows (for example the top 10 items), and whether to show Subtotals and a Grand total.
- Preview: Shows the report for yesterday at your location. Change the dates to try others, up to 31 days. This only changes the preview, not the saved report.
- Click Save. See Saving the report below.
Note: To change the order of the numbers or the groups, use the up and down arrows next to them. The X removes one.
Adding a filter
- Click Add a condition in the Filters box and pick the field, for example Order Type.
- Fill out the window:
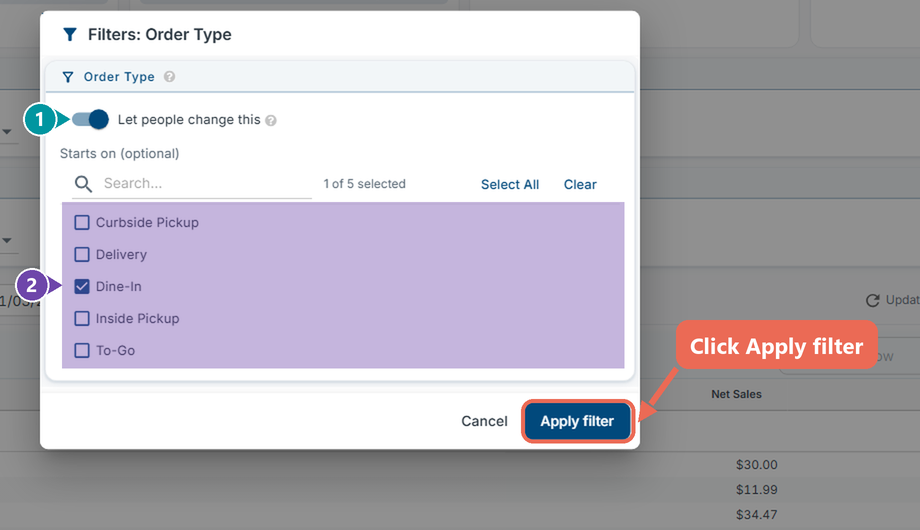
- Let people change this: Off, the filter always applies. On, the filter shows on the report page next to the dates and locations, so whoever runs the report can pick other values. What you tick here is what it starts on.
- Tick the values to keep. With the switch off, you can also choose is not to leave them out instead.
- Click Apply filter.
Example: Molly Manager builds Dine-In Sales by Reporting Group with Order Type set to Dine-In and Let people change this on. When she runs it, it shows dine-in sales, and she can switch it to To-Go on the report page without editing the report.
Saving the report
- Click Save at the bottom of the builder and fill out the window:
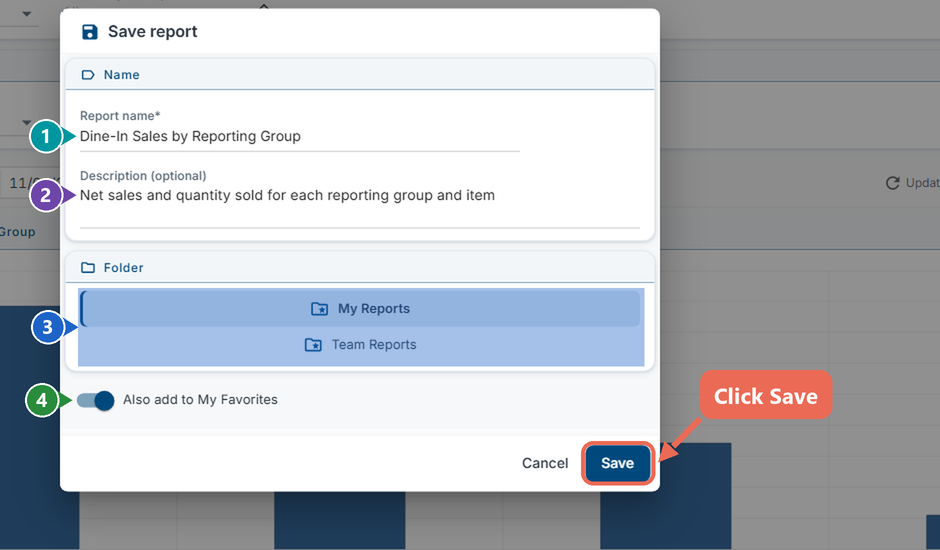
- Report name: The name in the menu (required).
- Description: A short note on what the report shows (optional). It shows under the report's name.
- Folder: Where to save it: My Reports (only you see it), Team Reports (shared with your team), or a folder inside either.
- Also add to My Favorites: Turn it on to also find the report under My Favorites.
- Click Save. The report opens, ready to run, and is listed under Custom Reports.
Click here to learn more about running a custom report.
Changing a report
Open the report and click Edit at the top right. The builder opens with the report as it was saved. Change what you need and click Save. To keep the original and save your changes as a new report, click Save as instead of Edit.
Good to know
- Net Sales matches the Sales Period Report for the same days and locations.
- When the dates include today, today's numbers are so far and change until the day is closed. The report says so.
- Reports can't show hours of the day; the closest is Day Part.
- Each report uses one kind of data. To see sales next to labor, use Sales & Labor.