
Menu Engineering Report
ThisThe is the Menu Engineering Report shows how menu items are performing based on both profitability and popularity. Items are categorized into groups (Stars, Plowhorses, Puzzles, Dogs) so you can quickly identify which dishes should be promoted, priced differently, reworked, or removed.
Where to find the report
- Backoffice --> Reporting --> Reports --> Sales folder --> Menu Engineering Report --> Select Date Range --> Execute
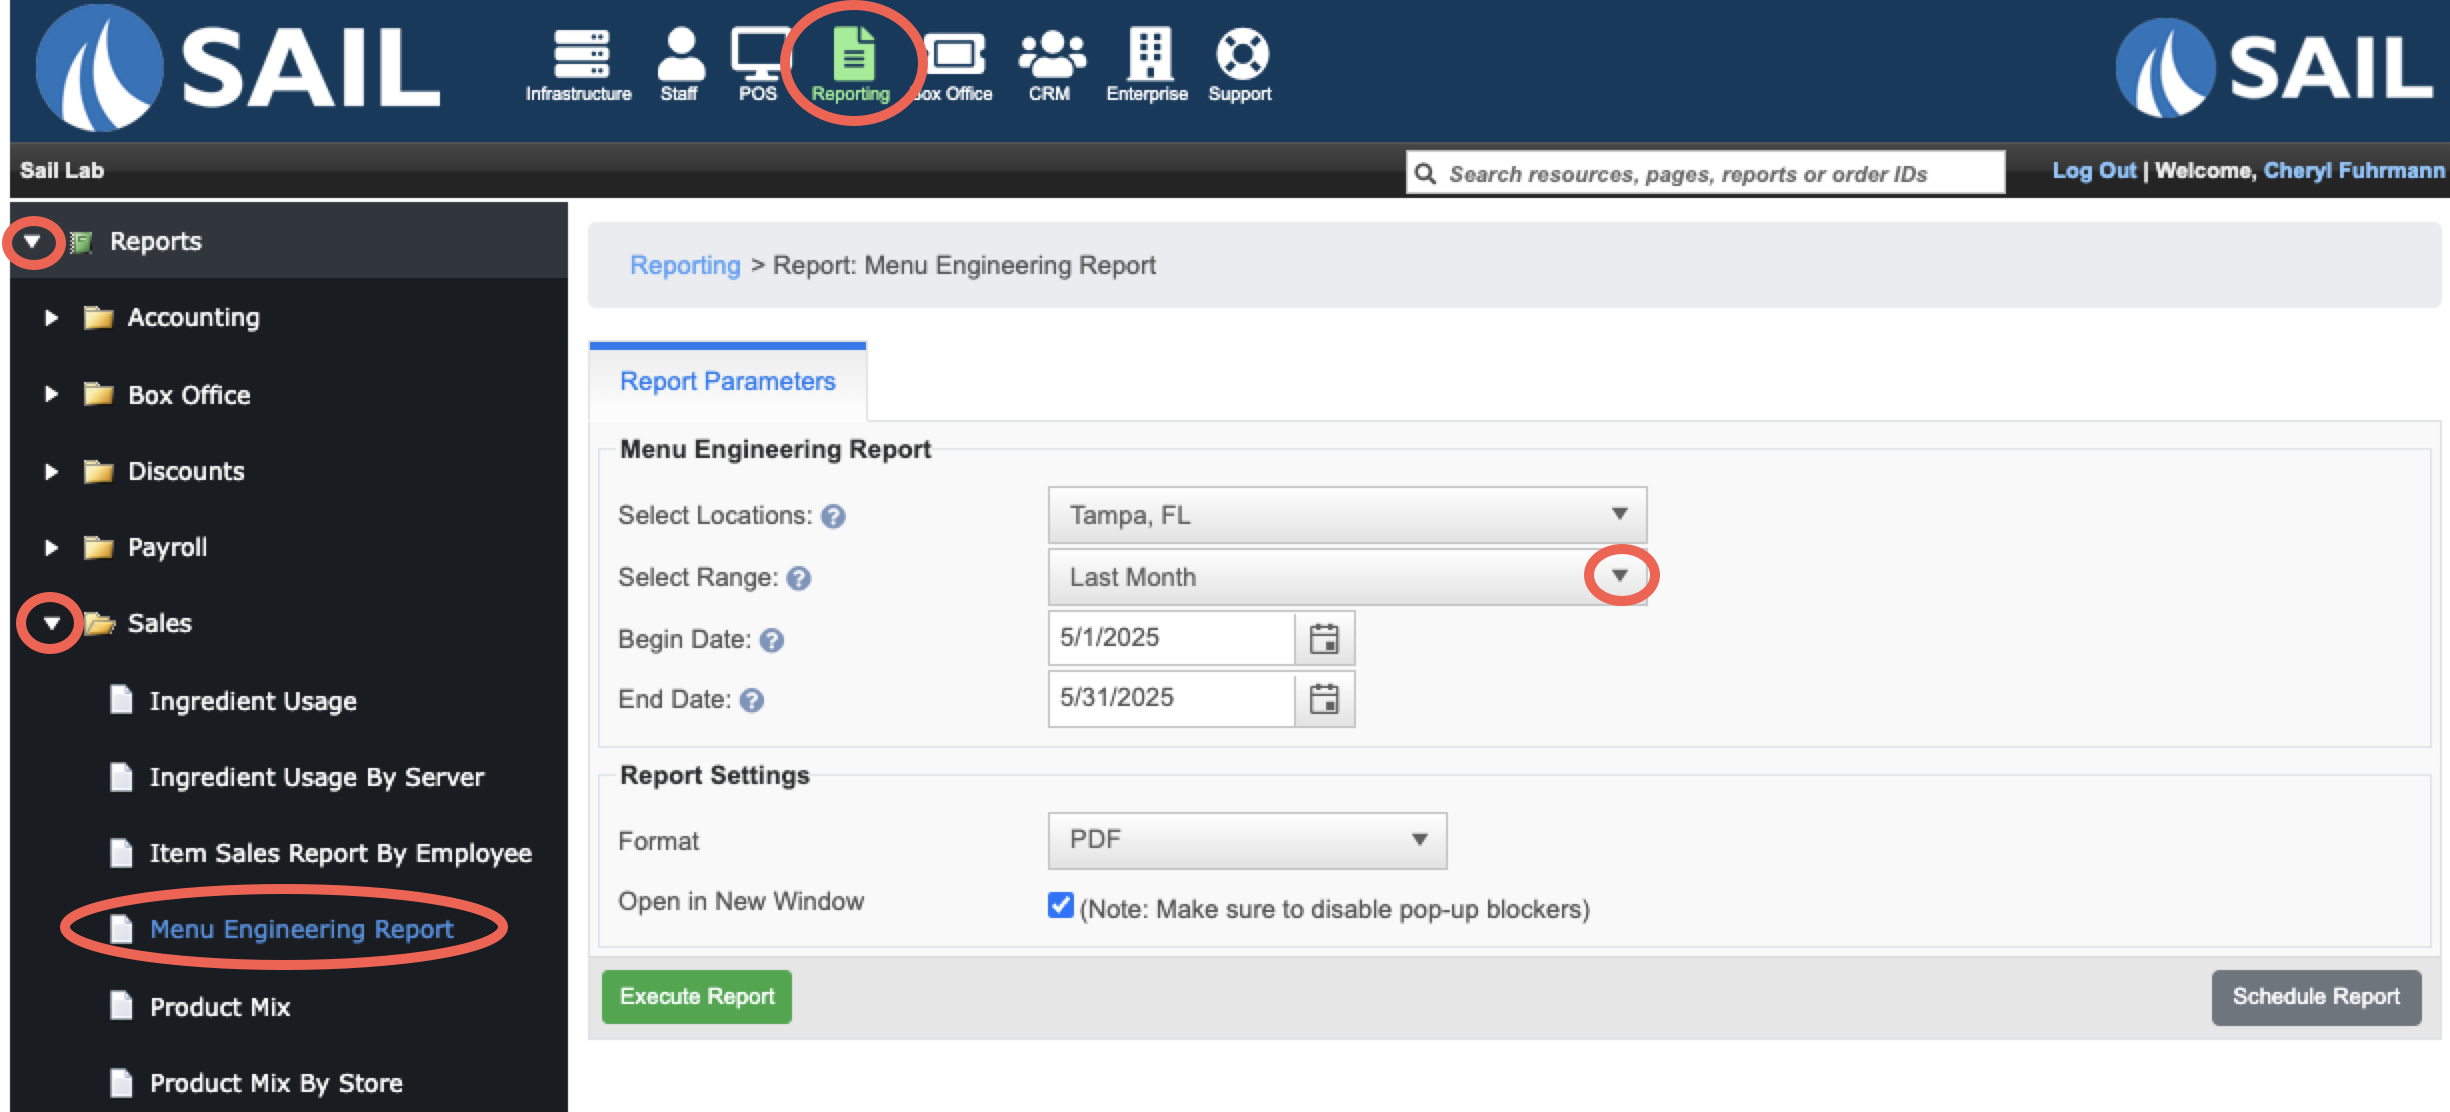
What it looks like
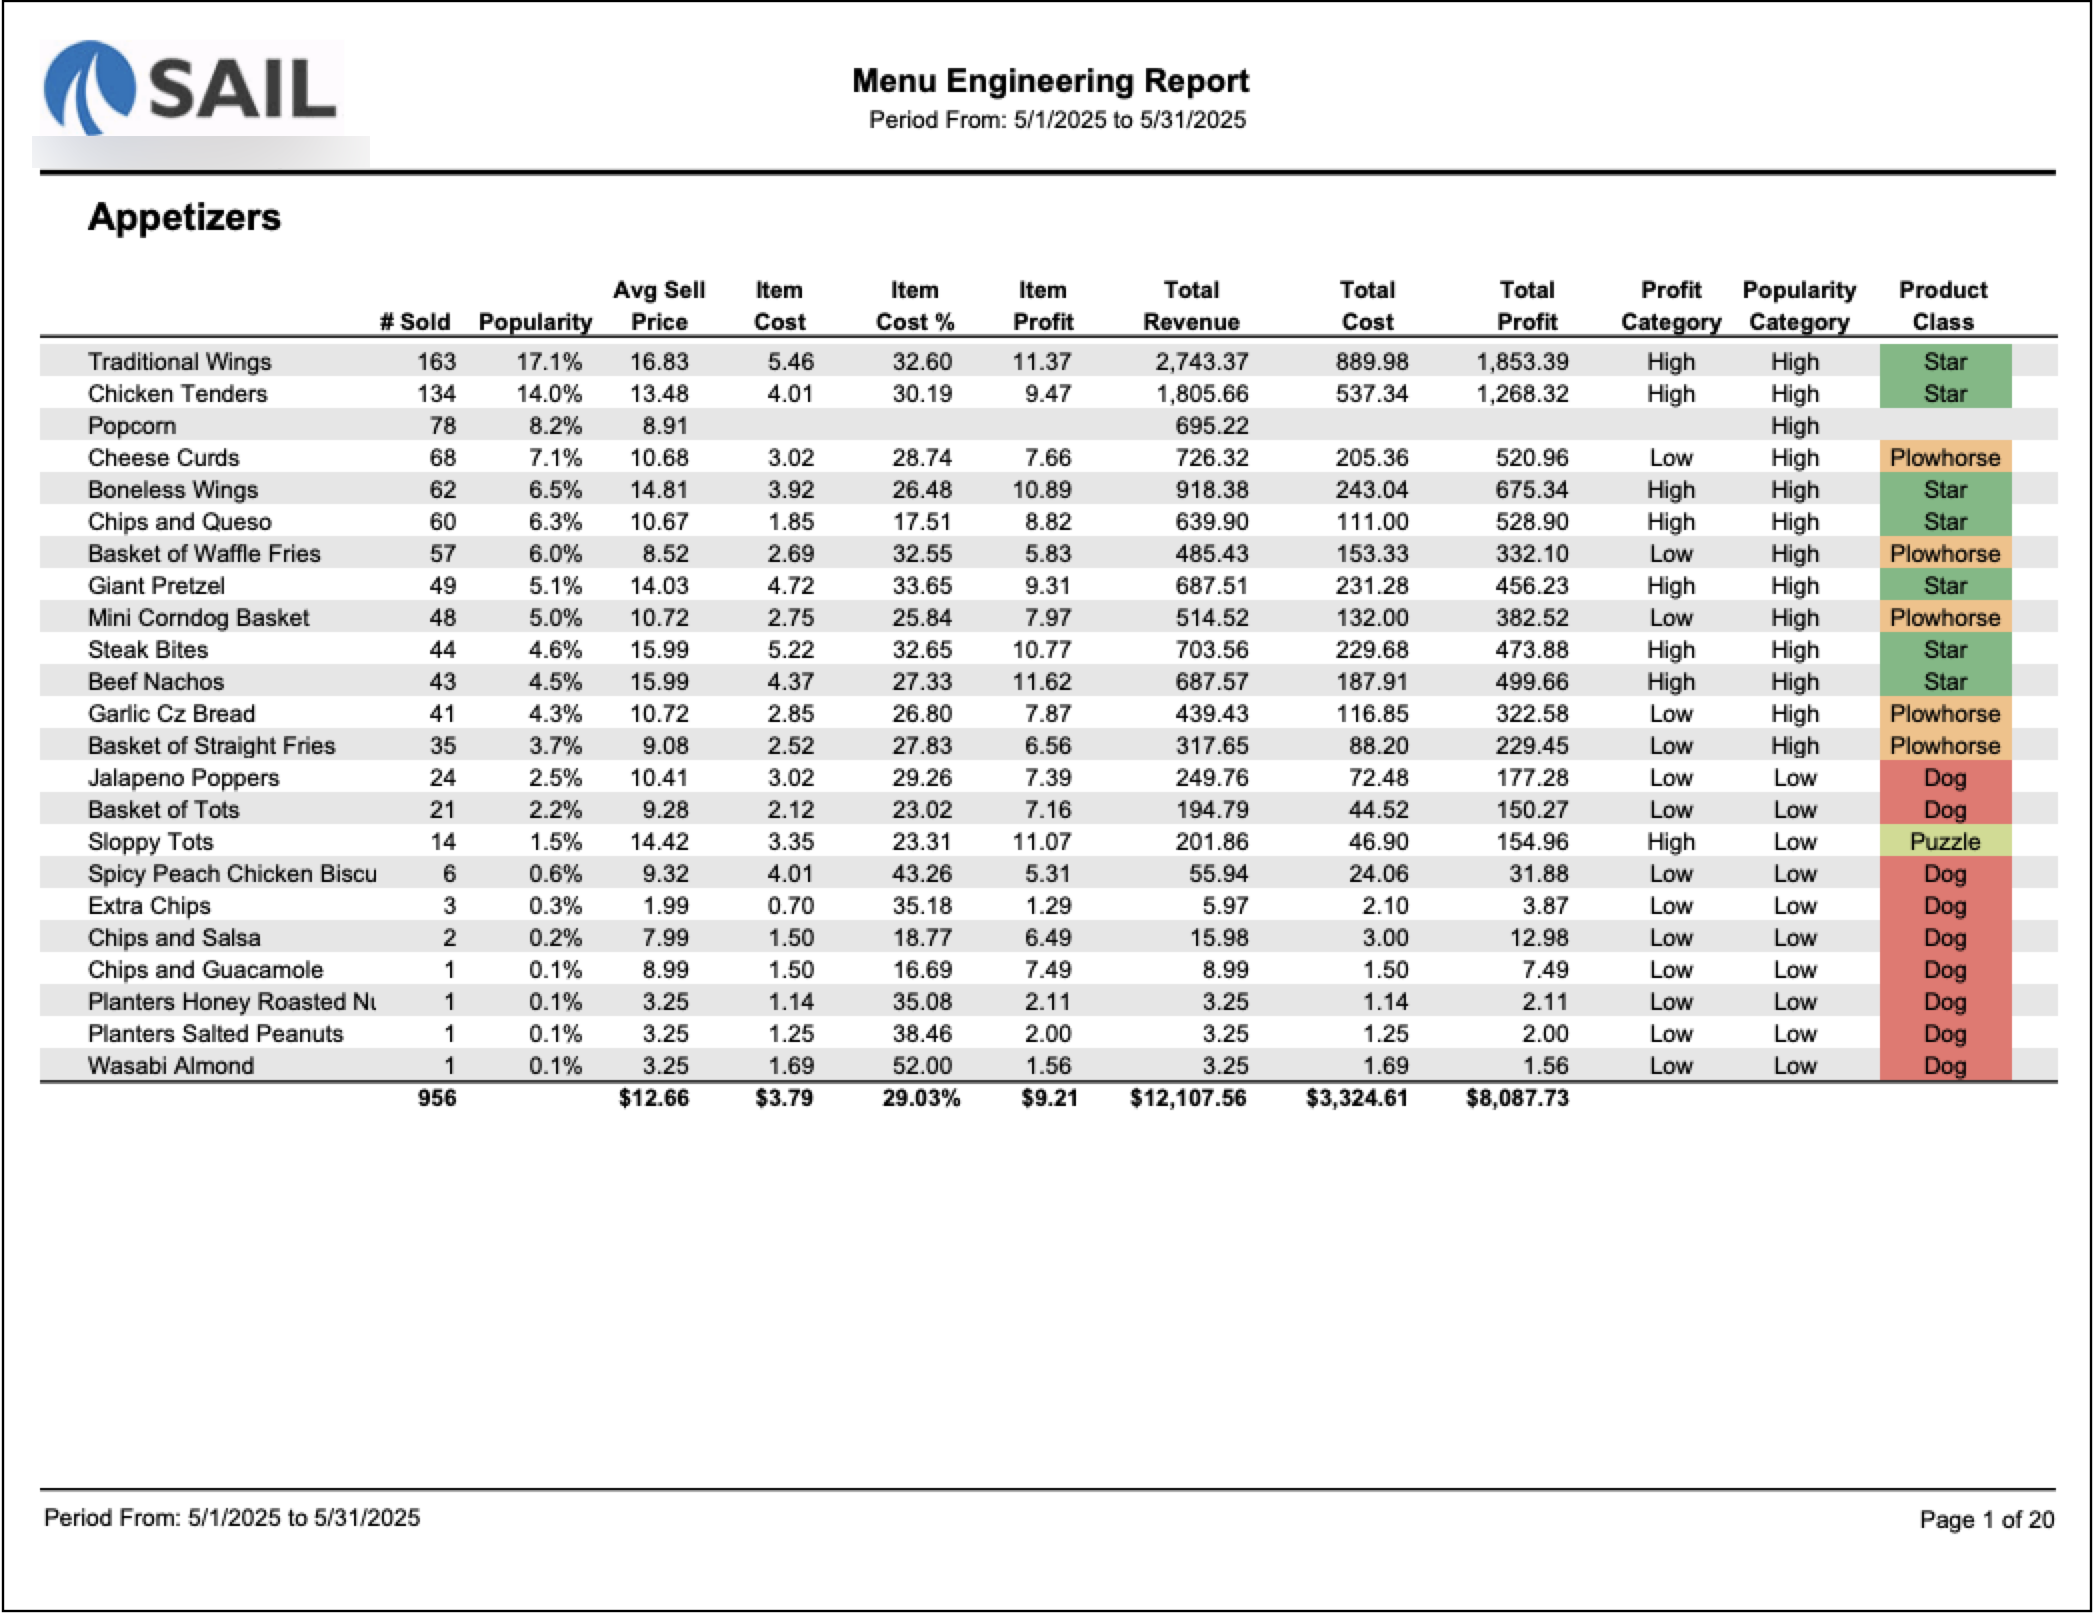
Report Parts
Organization
-
The report is organized by Reporting Group (e.g., Appetizers, Entrees, Desserts, Beer).
-
Within each group, items are listed in order of most sold to least sold (# Sold column).
-
This layout makes it easy to compare the top performers in each category and see which items contribute the most to sales volume.
Column Descriptions
-
# Sold – Total quantity of each item sold.
- Popularity (Popularity %) – The item’s share of sales volume within its group (menu category or the report set).
Formula: Popularity % = Units Sold ÷ Total Units Sold (same group) × 100 -
Avg Sell Price – Average price at which the item was sold.
- Item Cost - Is configured on the item itself (See below how to set the item cost)
-
Item Cost % – Shows how much of the selling price is taken up by cost.
Formula: Item cost ÷ Avg sell price -
Item Profit – Profit made per unit sold.
Formula: Avg sell price - Item Cost -
Total Cost – Total cost of all units sold.
-
Total Revenue – Total sales dollars generated.
-
Total Profit – Total profit of all units sold.
Formula: Total Revenue−Total Cost -
Profit Category – Shows whether the item is High or Low profit.
-
Popularity Category – Shows whether the item is High or Low popularity.
-
Product Class – Combines profit and popularity into one of four categories
What Do the Product Classes Mean?
In this report, each item is assigned a Product Class based on its performance in two key areas:
-
Profitability: How much profit each item generates.
-
Popularity: How often the item is sold compared to others.
These two dimensions are used to group items into four main Product Classes:Classes:
⭐ Star
-
High Profit + High Popularity
-
These are your top-performing items. They sell well and generate strong profits.
-
You want to promote and protect these items—they’re your menu heroes.
🧩 Puzzle
-
High Profit + Low Popularity
-
These items make good money but don’t sell often.
-
Consider marketing them more or training staff to recommend them, as they have strong profit potential.
🐴 Plowhorse
-
Low Profit + High Popularity
-
These are your workhorse items—people love them, but they don’t generate much profit.
-
You might explore ways to make them more profitable without losing their popularity (e.g., raising the price or adjusting ingredients).
❌ Dog
-
Low Profit + Low Popularity
-
These items neither sell well nor make good profit.
-
It may be time to remove or rework these items unless they serve a strategic purpose (like customer expectations or brand identity).
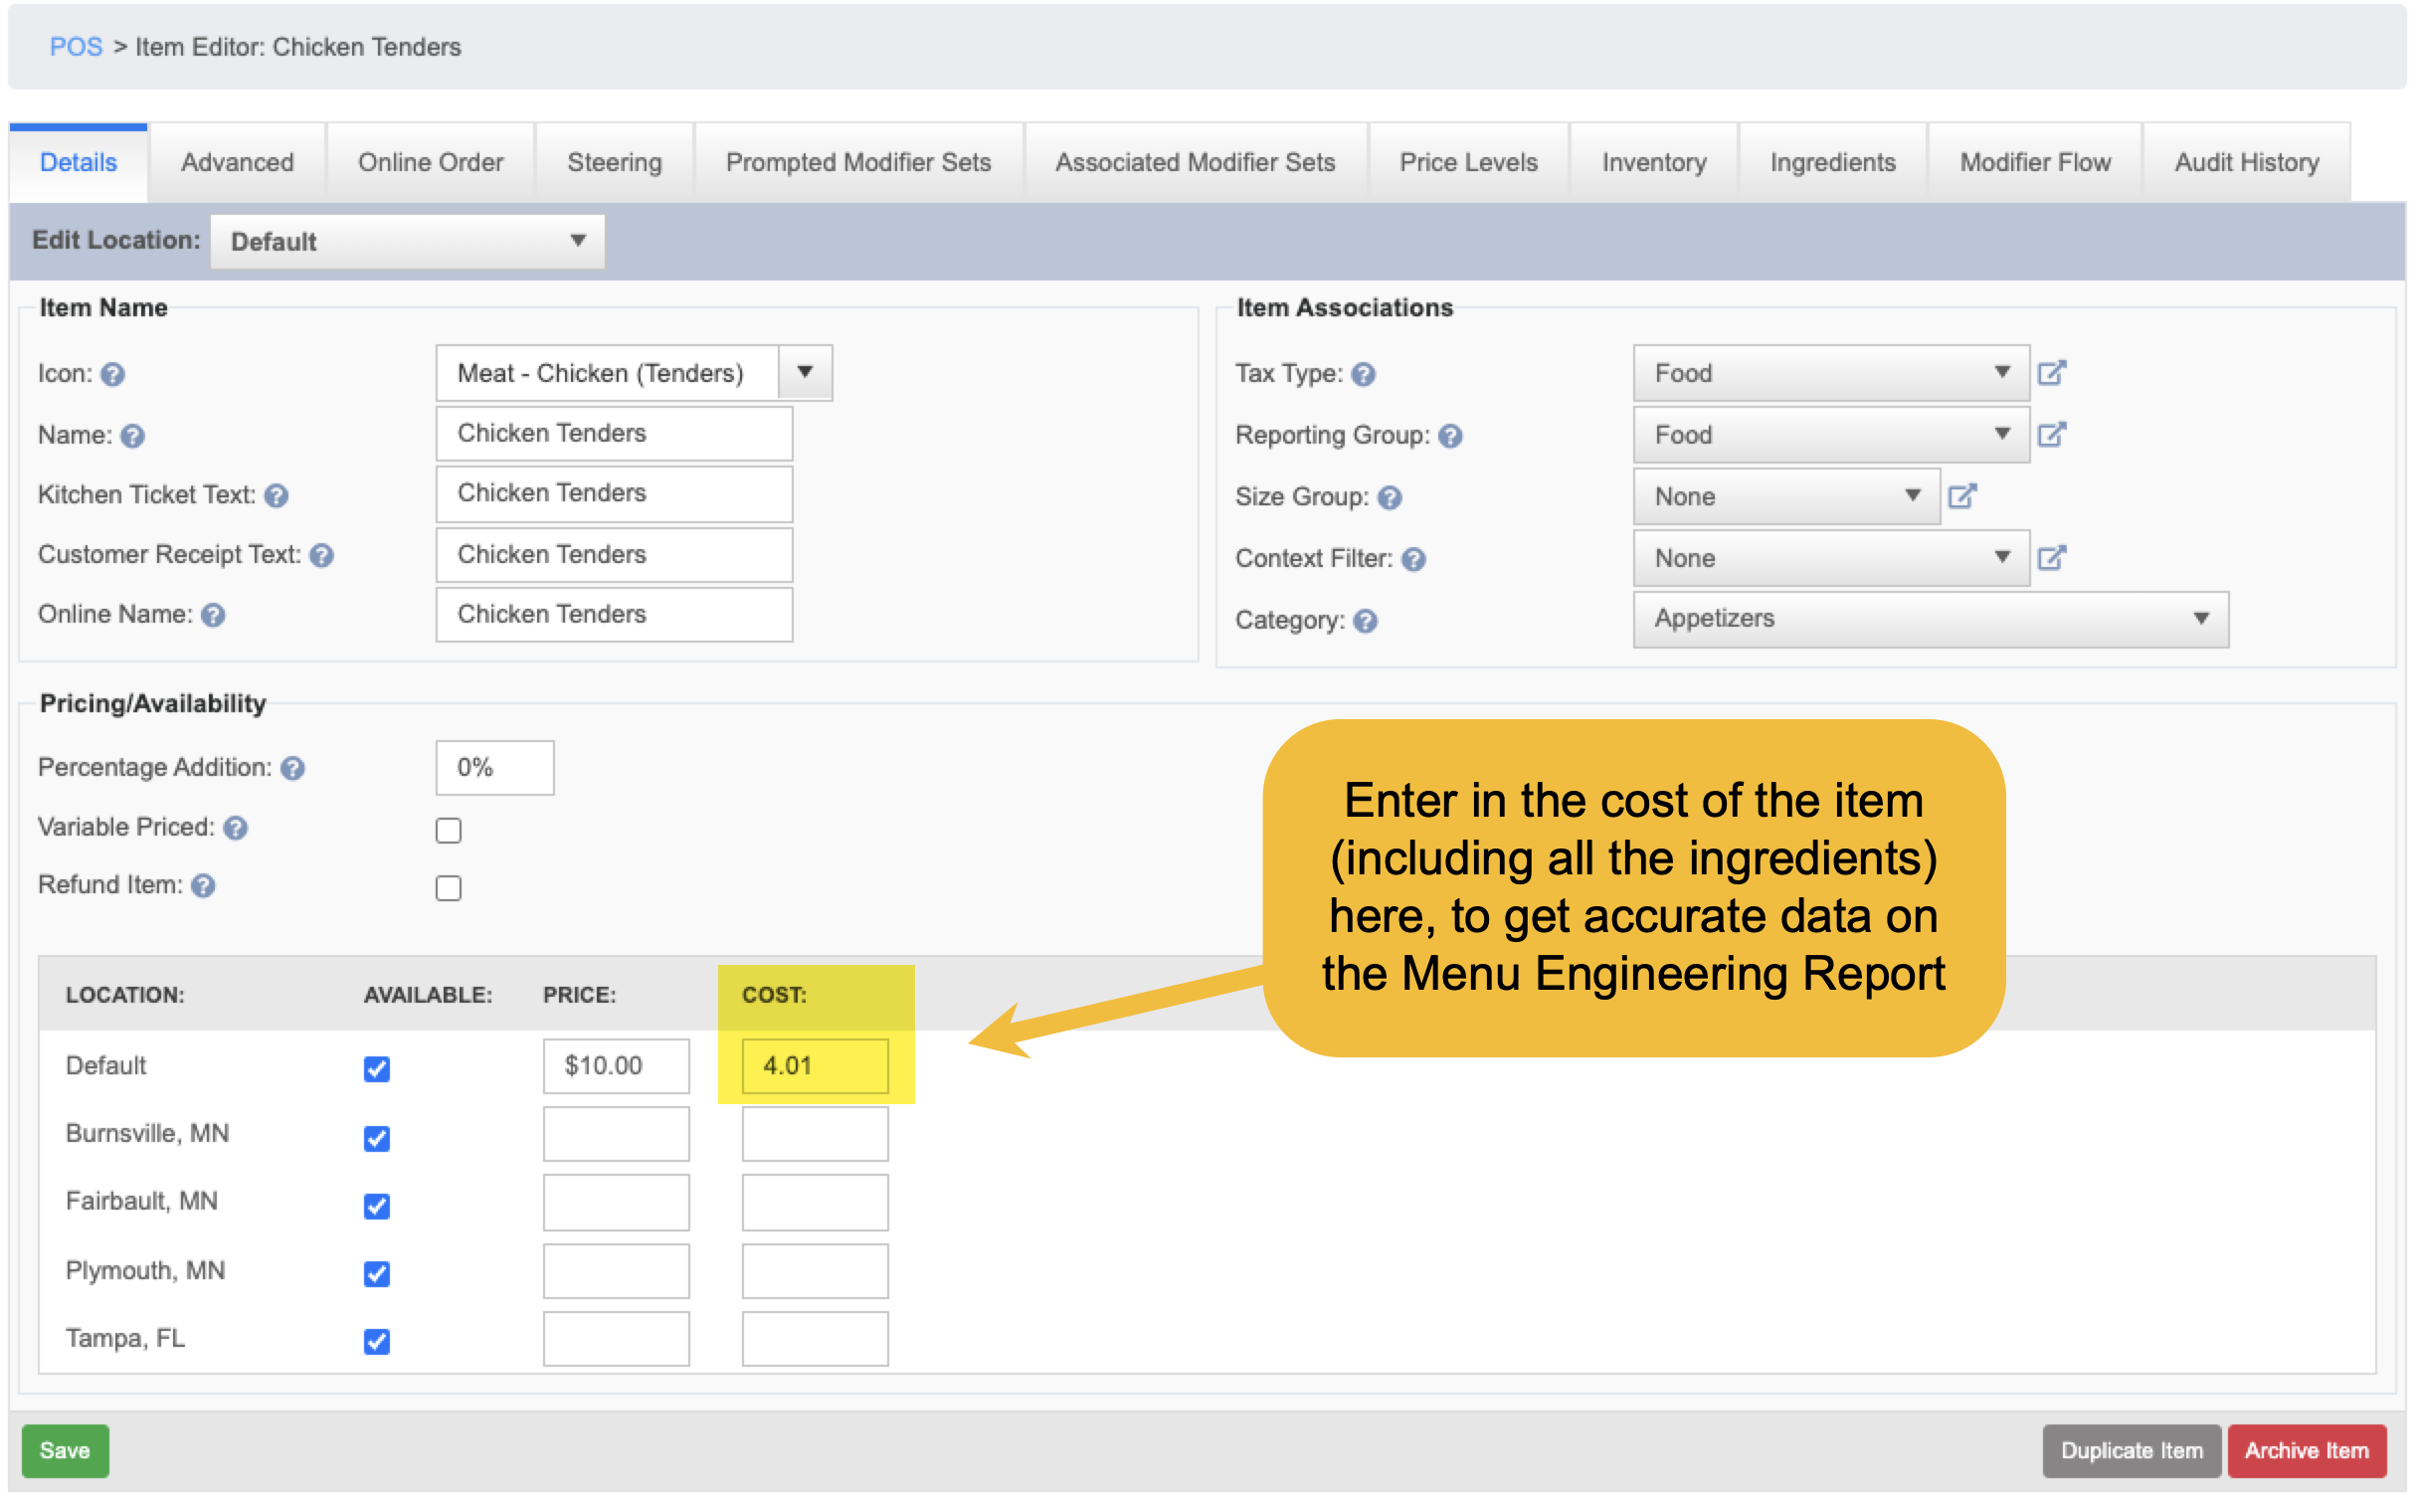
How to set the item cost on the item
- Find the item
- Enter in the cost of the item (including all the ingredients) into the cost box
Why Accurate Item Costs Matter
The Product Class for each item depends heavily on its profitability,profitability, and profitability is calculated using the Item Cost.Cost.
Here's how it works:
🔹 Profit = Sell Price – Item Cost
For example, if a drink sells for $10 and the ingredients cost $3, the profit is $7. That’s a high-profit item.
But if the item cost is entered incorrectly — say, it’s entered as $5 instead of $3 — then the system will calculate the profit as only $5 instead of $7. That difference can affect how the item is classified.
If Item Costs Are Missing or Incorrect...
-
The Total
Profit,Profit, Item Cost %, and Profit Category will be inaccurate. -
That means the Product Class (Star, Puzzle, Plowhorse, Dog) might also be wrong.
-
For example, an item might look like a Dog (low profit) when it's really a
Star,Star, just because the cost data is off.
What to Do
-
Double-check that all Item Costs are entered correctly in your system.
-
Review any items that are unexpectedly marked as Dog or Plowhorse — incorrect costs might be the reason.
Accurate cost data = accurate insights!
How to Use This Report
-
Focus on Stars to drive both sales and margins.
-
Review Plowhorses for pricing or portion adjustments.
-
Highlight Puzzles with promotions or better menu placement.
-
Evaluate Dogs for potential removal to streamline the menu.
-
Run this report monthly or quarterly to track how menu changes impact sales and profitability.