
Product Mix Report
ThisThe is the Product Mix Report provides a detailed breakdown of every item and modifier sold during the selected date range.
It’s the most commonly used sales report for reviewing menu performance, analyzing pricing accuracy, and identifying top- and low-selling items across all categories and reporting groups.
Where to find the report
- Backoffice --> Reporting --> Reports --> Sales folder --> Product Mix --> Select Date Range --> Execute
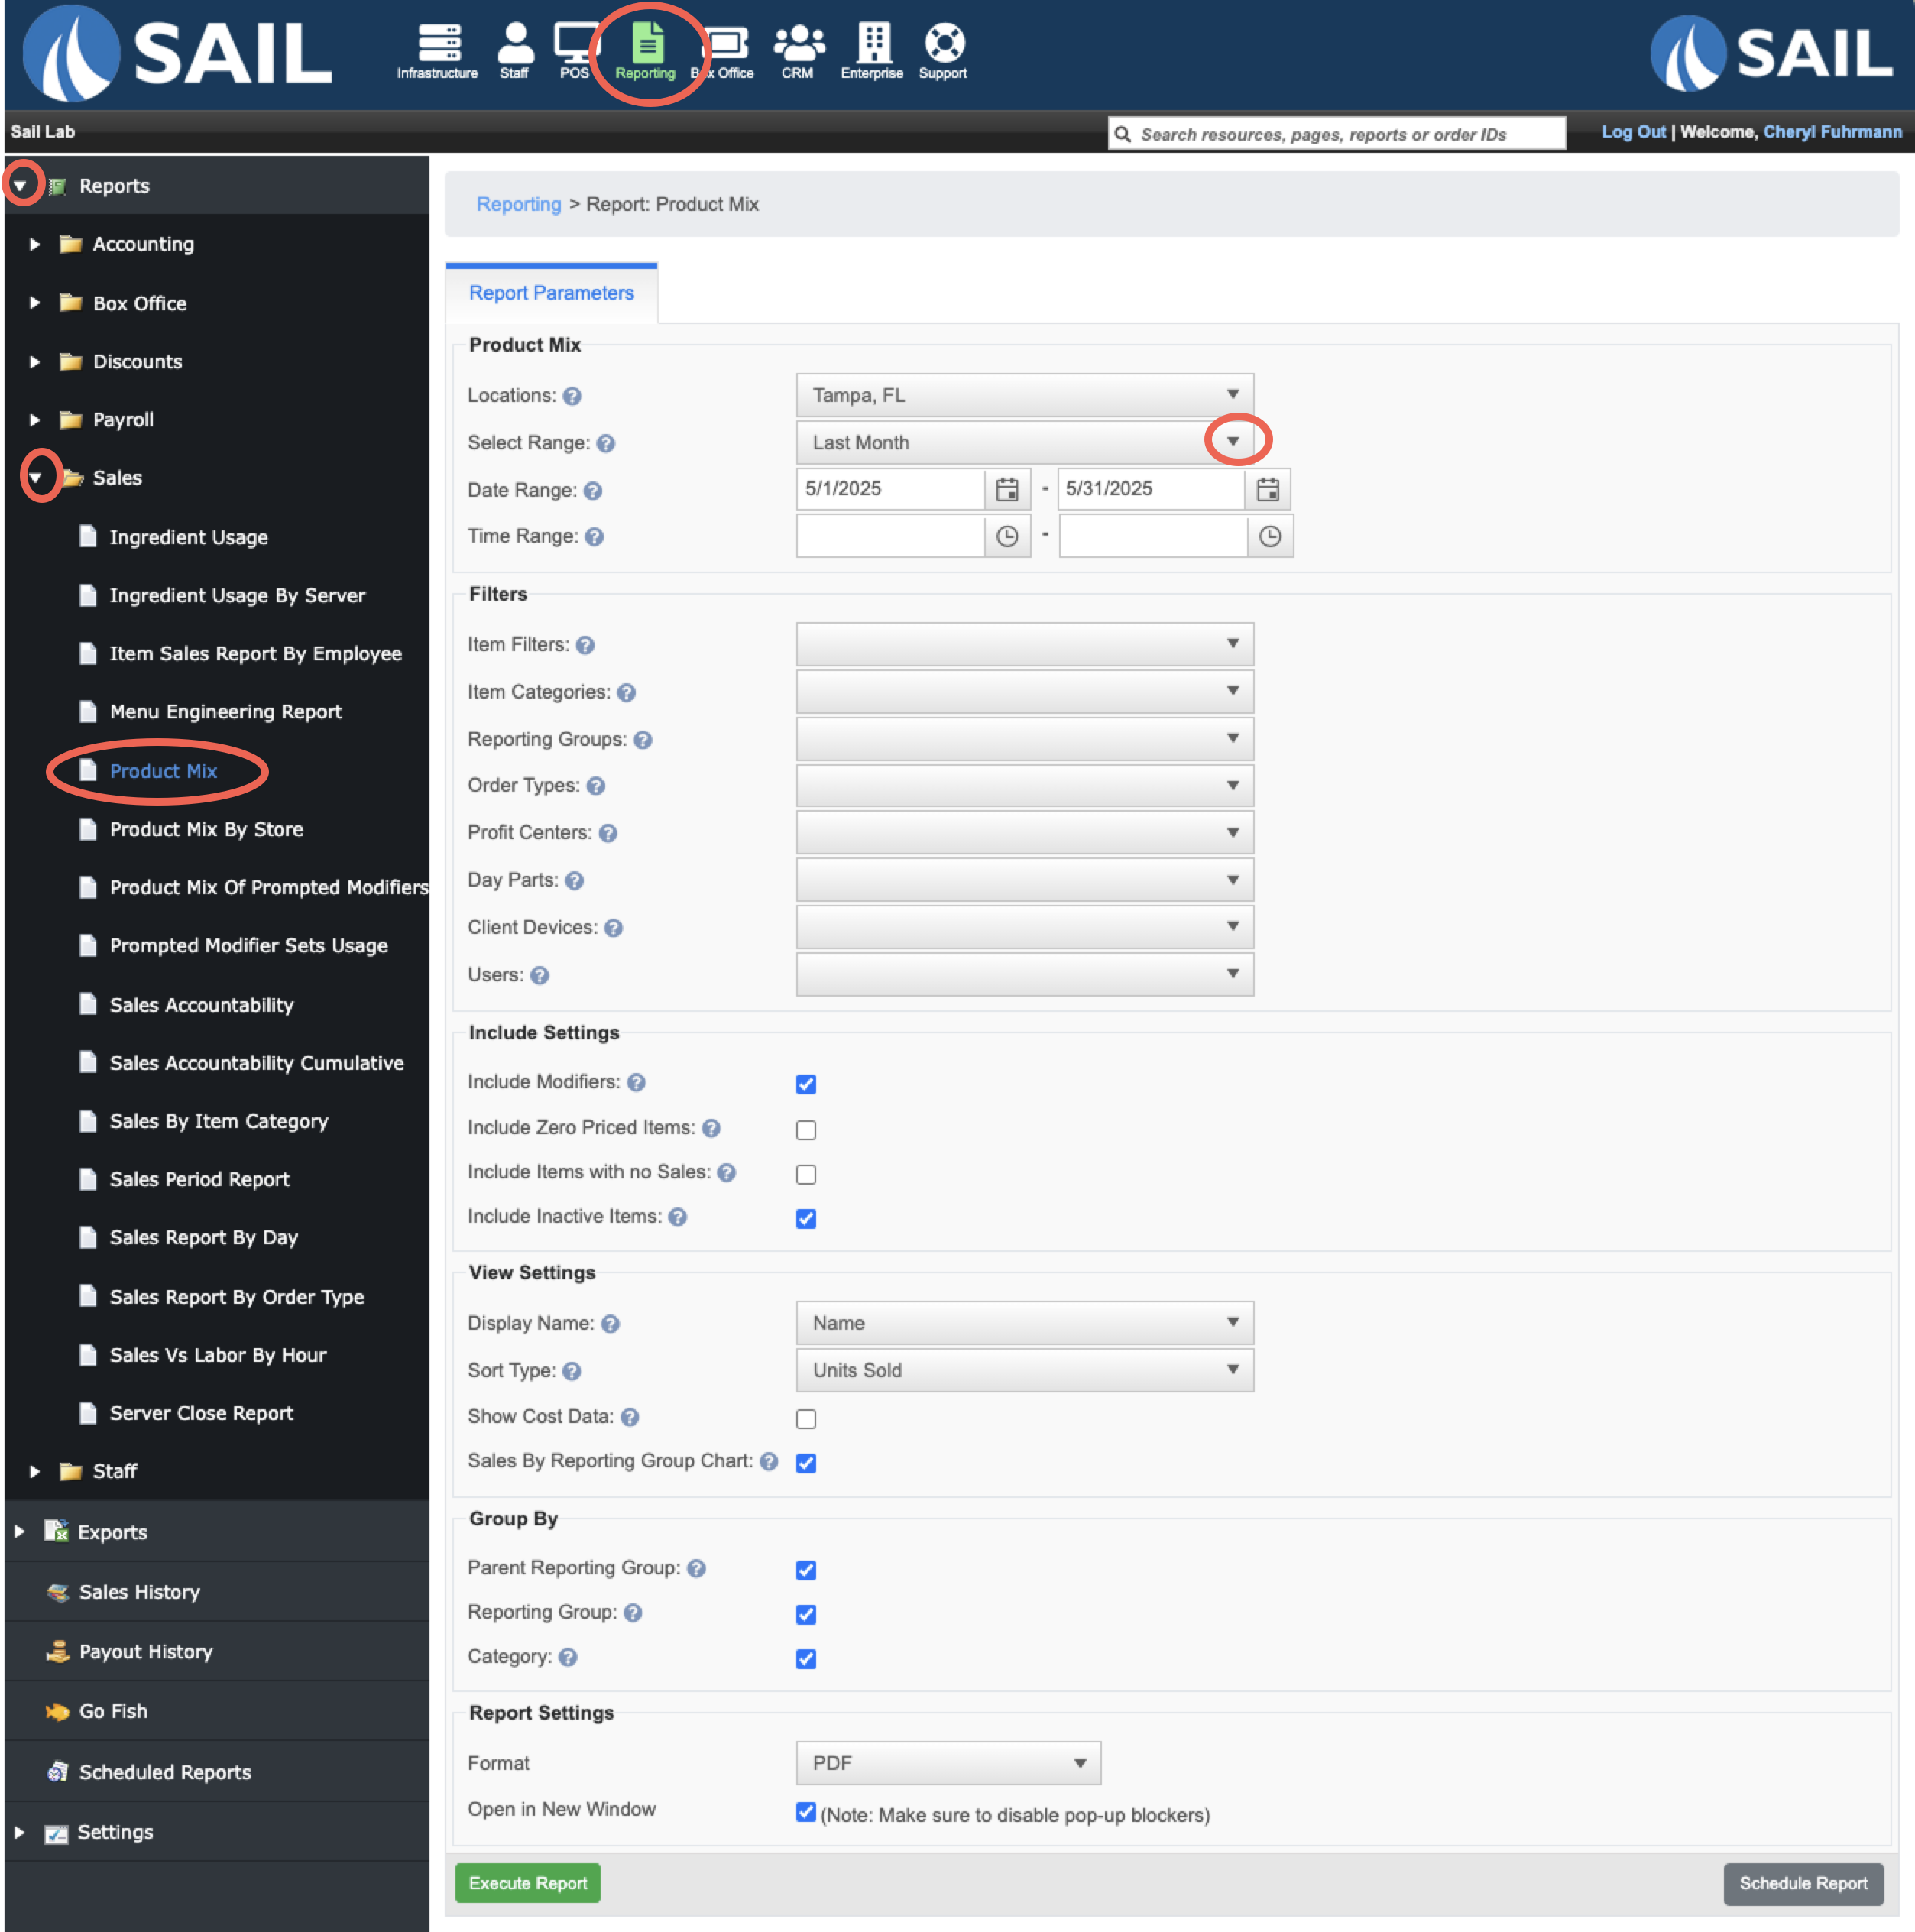
Report Options
-
Locations – Select one or more locations to include in the report.
When multiple locations are selected, all sales are combined into a single total. -
Select Range / Date Range / Time Range – Choose a preset date range (e.g., Today, Last Week, Last Month) or manually enter custom start and end dates/times.
Filters
All filters are multi-select, allowing you to narrow results to one or more options in each list.
If no filters are chosen, the report includes everything within the selected date range.
When combining filters, the report will only return data that matches all selections.
(For example, filtering by “Beer” category and “Terminal 1” device will show only beer sold on Terminal 1.)
-
Item Filters – Custom item groups configured in Backoffice (e.g., Food Specials, Top 20 Items).
-
Item Categories – Menu categories assigned to items (e.g., Appetizers, Entrees, Desserts).
-
Reporting Groups – High-level groupings such as Food, Alcohol, Merchandise.
-
Order Types – Filter by order type such as Dine In, To-Go, Delivery, Online.
-
Profit Centers – Separate sales by operational area, such as Main Dining, Bar, Patio, Online Ordering.
-
Day Parts – Filter by preconfigured time periods (e.g., Lunch, Dinner, Late Night).
-
Client Devices – Filter by the terminal or handheld used to ring in sales.
-
Users – Filter by the employee who rang in the sale.
Include Settings
-
Include Modifiers – Adds each sold modifier item (e.g., Bacon, Ranch, Extra Cheese) as its own line item in the report.
Modifier items are listed alphabetically and are not grouped under their parent menu items. -
Include Zero-Priced Items – Includes items that have a $0 default price.
These are often variable-price items (where the price is entered manually) or non-charged items such as Silverware or Ketchup. -
Include Items with No Sales – Displays every configured menu item, even if it wasn’t sold during the selected time frame.
(Useful for menu audits.) -
Include Inactive Items – Shows items that have been deactivated but still have past sales history.
View Settings
-
Display Name – Choose how item names are displayed (e.g., Name or
ShortKitchen Name, or Receipt Name). -
Sort Type – Determines the order of results, such as by Units
SoldSold,orSalesAmountAmount, Profit, or Name. -
Show Cost Data – Adds columns for Cost, Total Cost, and Total Profit.
These will only display data if cost values have been entered for each item or modifier. -
Sales by Reporting Group Chart – Displays a pie chart at the top showing total sales by Reporting Group.
Group By
These options control how the report is organized.
By default, all three boxes are checked, showing four layers:
Parent Reporting Group → Reporting Group → Category → Item.
-
Parent Reporting Group – Top-level grouping (e.g., Alcohol).
-
Reporting Group – Sub-groups within the parent (e.g., Liquor, Beer, Wine).
-
Category – Menu categories under each reporting group (e.g., Cocktails, Bottle Beer, Wine by Glass).
Unchecking any box removes that layer:
-
If Category is unchecked → items appear under their reporting group without category separation.
-
If both Reporting Group and Category are unchecked → all items display in one continuous list, sorted by your selected sort type.
What it looks like
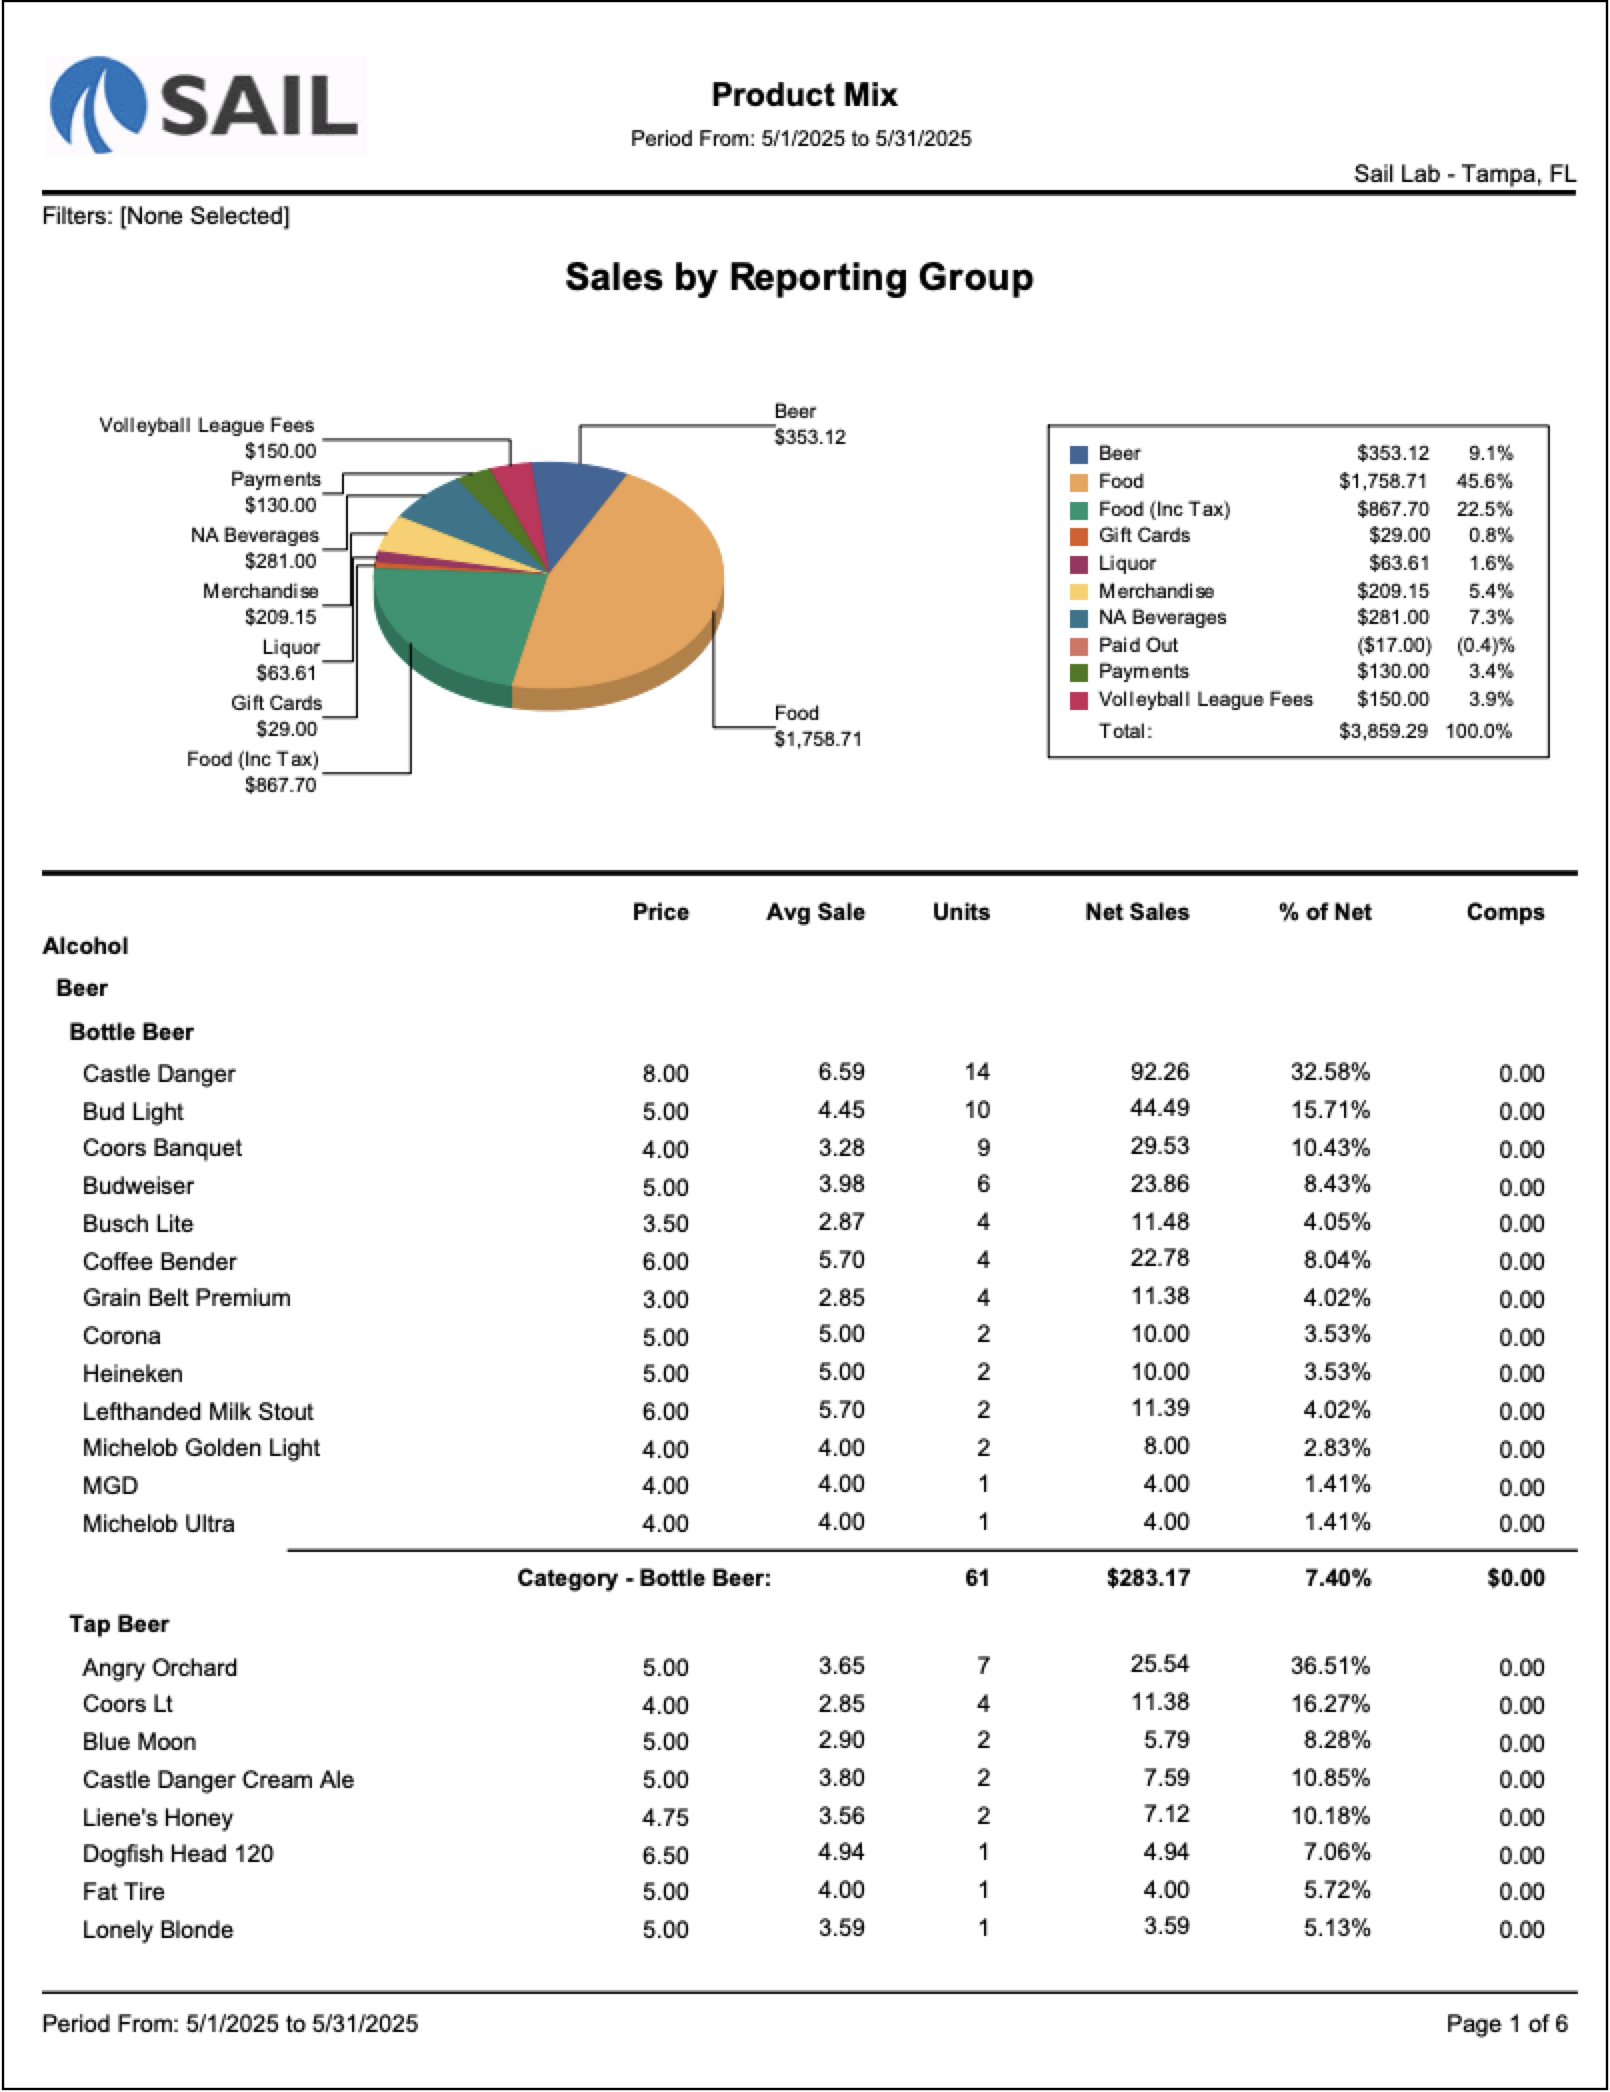
Report Parts
Pie Chart
- Displays total sales by Reporting Group as a visual breakdown of where revenue is coming from.
Organization / Sections
The report is grouped in up to four layers (depending on your “Group By” settings):
-
Parent Reporting Group – The top-level category (e.g., Alcohol, Food, Merchandise).
-
Reporting Group – The next level down (e.g., Liquor, Beer, Wine).
-
Category – The menu category under that reporting group (e.g., Cocktails, Bottled Beer, Tap Beer).
-
Item – The specific menu item.
-
-
-
If you change the “Group By” settings, the report adjusts automatically:
-
Unchecking Category lists all items directly under their reporting group.
-
Unchecking both Reporting Group and Category displays all items in one continuous list, sorted by your chosen “Sort Type.”
Columns
Subtotals / Grand Totals
-
Category Totals: Sum of all items within each category.
-
Reporting Group Totals: Combine all categories under that group.
-
Parent Reporting Group Totals: Roll up all reporting groups under the top-level grouping.
-
Grand Total: Appears at the bottom, showing all sales combined across the report.
Special Behaviors
-
When Include Modifiers is selected, each modifier appears as its own line item, mixed alphabetically within its category.
-
If Show Cost Data is checked but cost values haven’t been entered in Backoffice, the cost and profit columns will remain blank.
-
Filtering by incompatible options (for example, Beer Category + Food Reporting Group) will return no data.
-
Multi-select filters can be used to compare multiple users, devices, or profit centers.
-
If no filters are chosen, the report includes all items and modifiers across the selected date range.
How to Use This Report
-
Review top-selling items and their contribution to total sales.
-
Identify slow-moving or zero-sale items to consider removing or reconfiguring.
-
Check that average prices align with intended pricing and discounts.
-
Use cost and profit data (if configured) to evaluate item-level profitability.
-
Compare item counts versus revenue to spot high-volume, low-value menu items.
-
Run the report regularly to monitor sales mix shifts after menu changes or promotions.
-
Export the report to Excel for deeper analysis, sorting, or trend tracking.