
Sales by Item Category Report
ThisThe is the Sales by Item Category Report shows sales activity summarized by item category within broader reporting groups (such as Food, Liquor, Beer, Beverages, etc.). It helps managers quickly see which categories are driving sales, how much volume is being sold, and each category’s contribution as a percentage of total sales.
Where to find the report
- Backoffice --> Reporting --> Reports --> Sales folder --> Sales by Item Category --> Select Date Range --> Execute
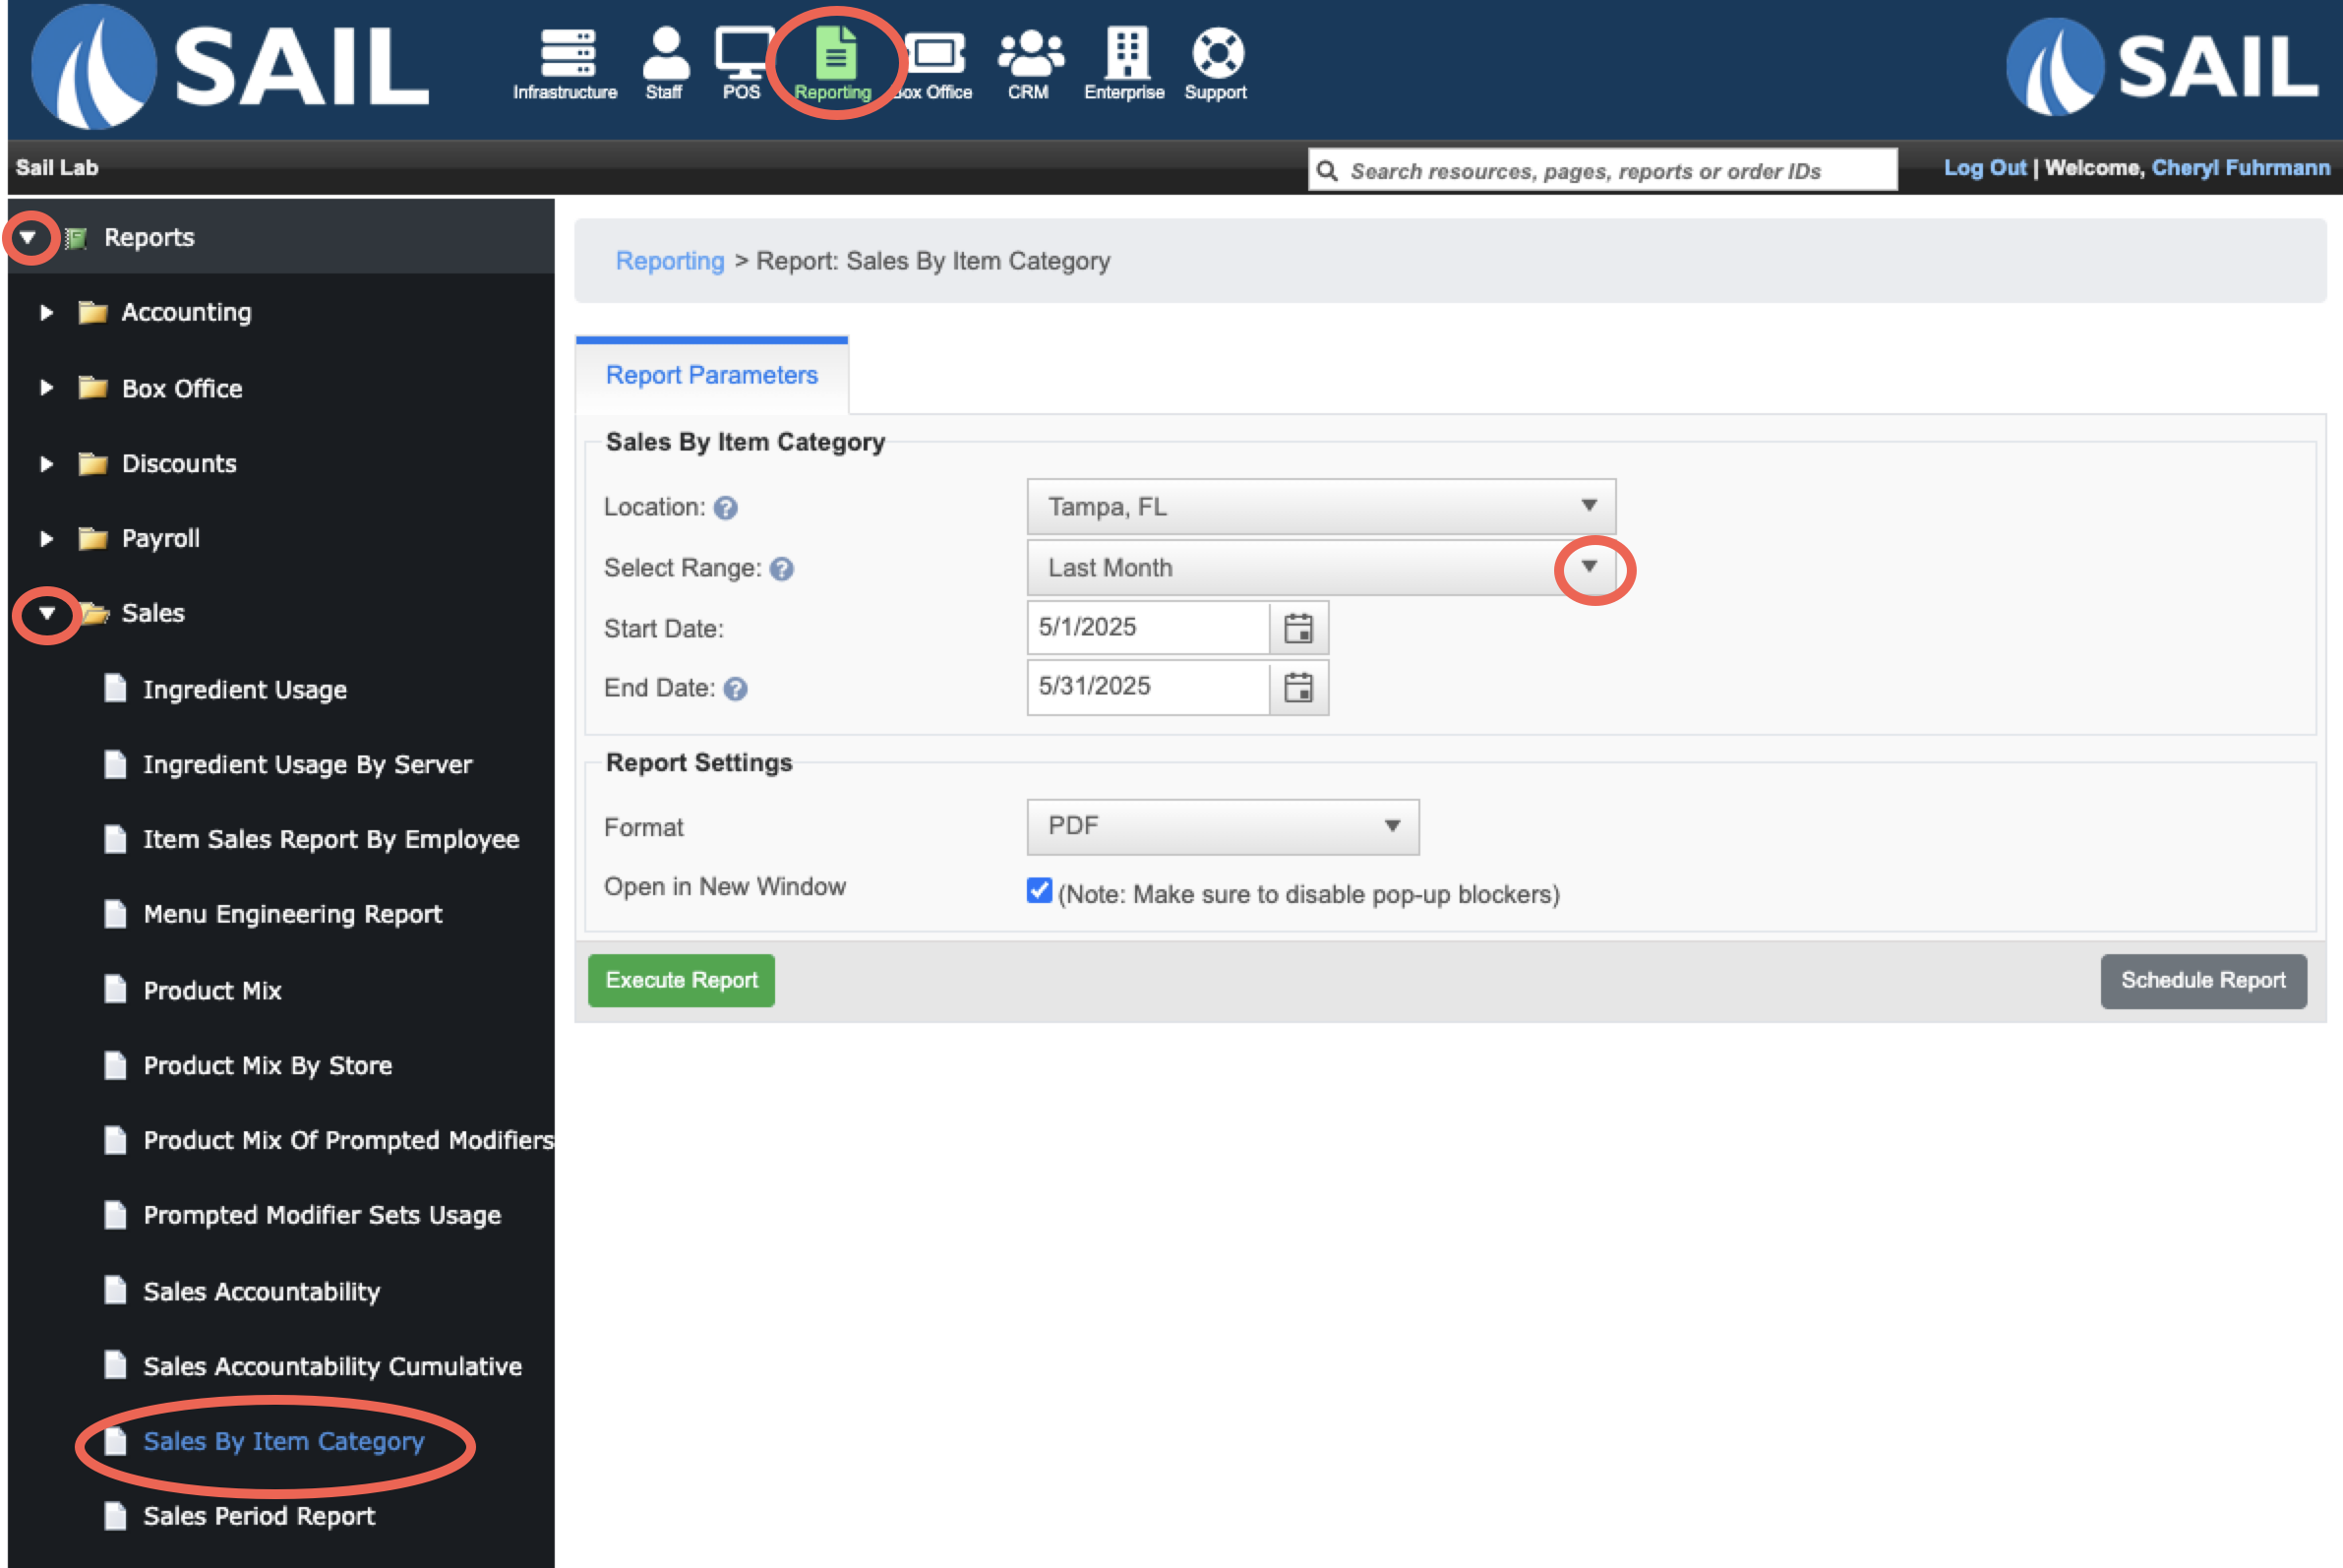
What it looks like
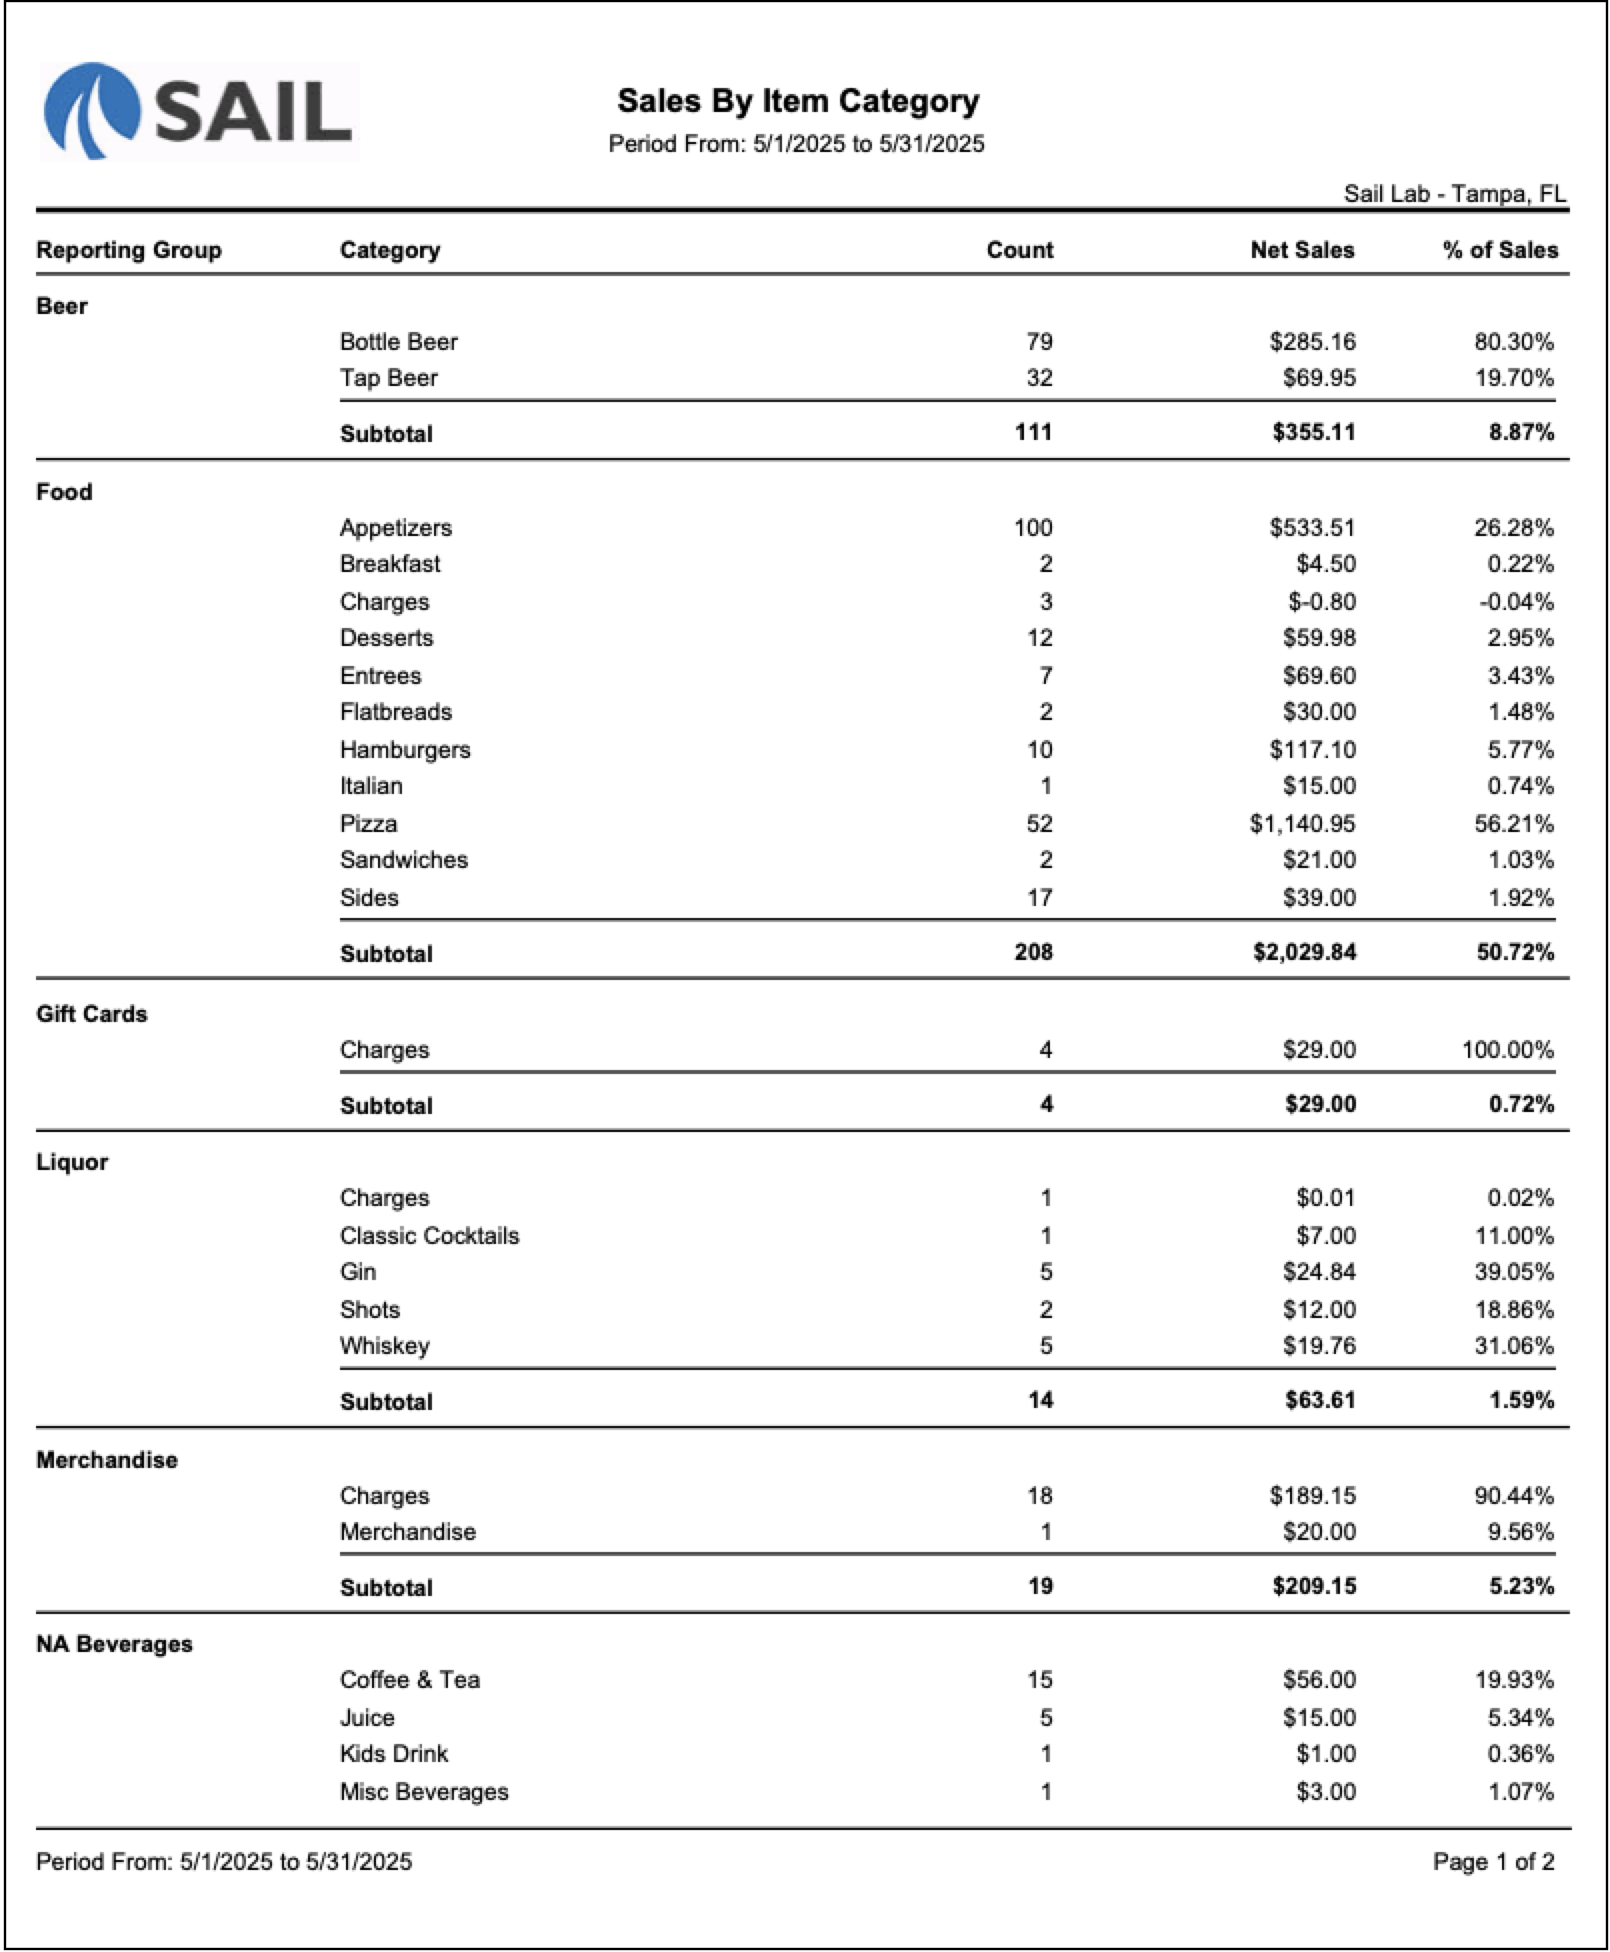
Report Parts
Report Structure
-
Reporting Groups: Major sections (e.g., Food, Liquor, Beer, Beverages, etc.).
-
Categories: Individual categories within each reporting group (e.g., Sandwiches, Rum, Bottled Beer).
-
Data Columns:
-
Count – The number of times items in that category were sold.
-
Net Sales – Total sales in dollars for that category, after discounts and comps.
-
% of Sales – Share of the reporting group’s sales represented by this category.
-
-
Subtotals: At the bottom of each reporting group, totals are shown with the group’s percentage of overall sales.
-
Report Total: At the end, the overall count, sales, and percentages for the entire report period are displayed
How to Use This Report
-
Use this report to see which categories sell the most (e.g., Sandwiches vs. Salads).
-
Check how much of your sales come from liquor, beer, wine, or non-alcoholic drinks.
-
Look for categories with very small sales (like Candy) to see if they should stay on the menu.
-
Compare % of Sales to spot your strongest categories — this shows where most of your revenue is coming from.
-
Use the subtotals at the bottom of each group to see how much Food vs. Liquor vs. Beer contributes to your overall sales.