
Sales Report by Day
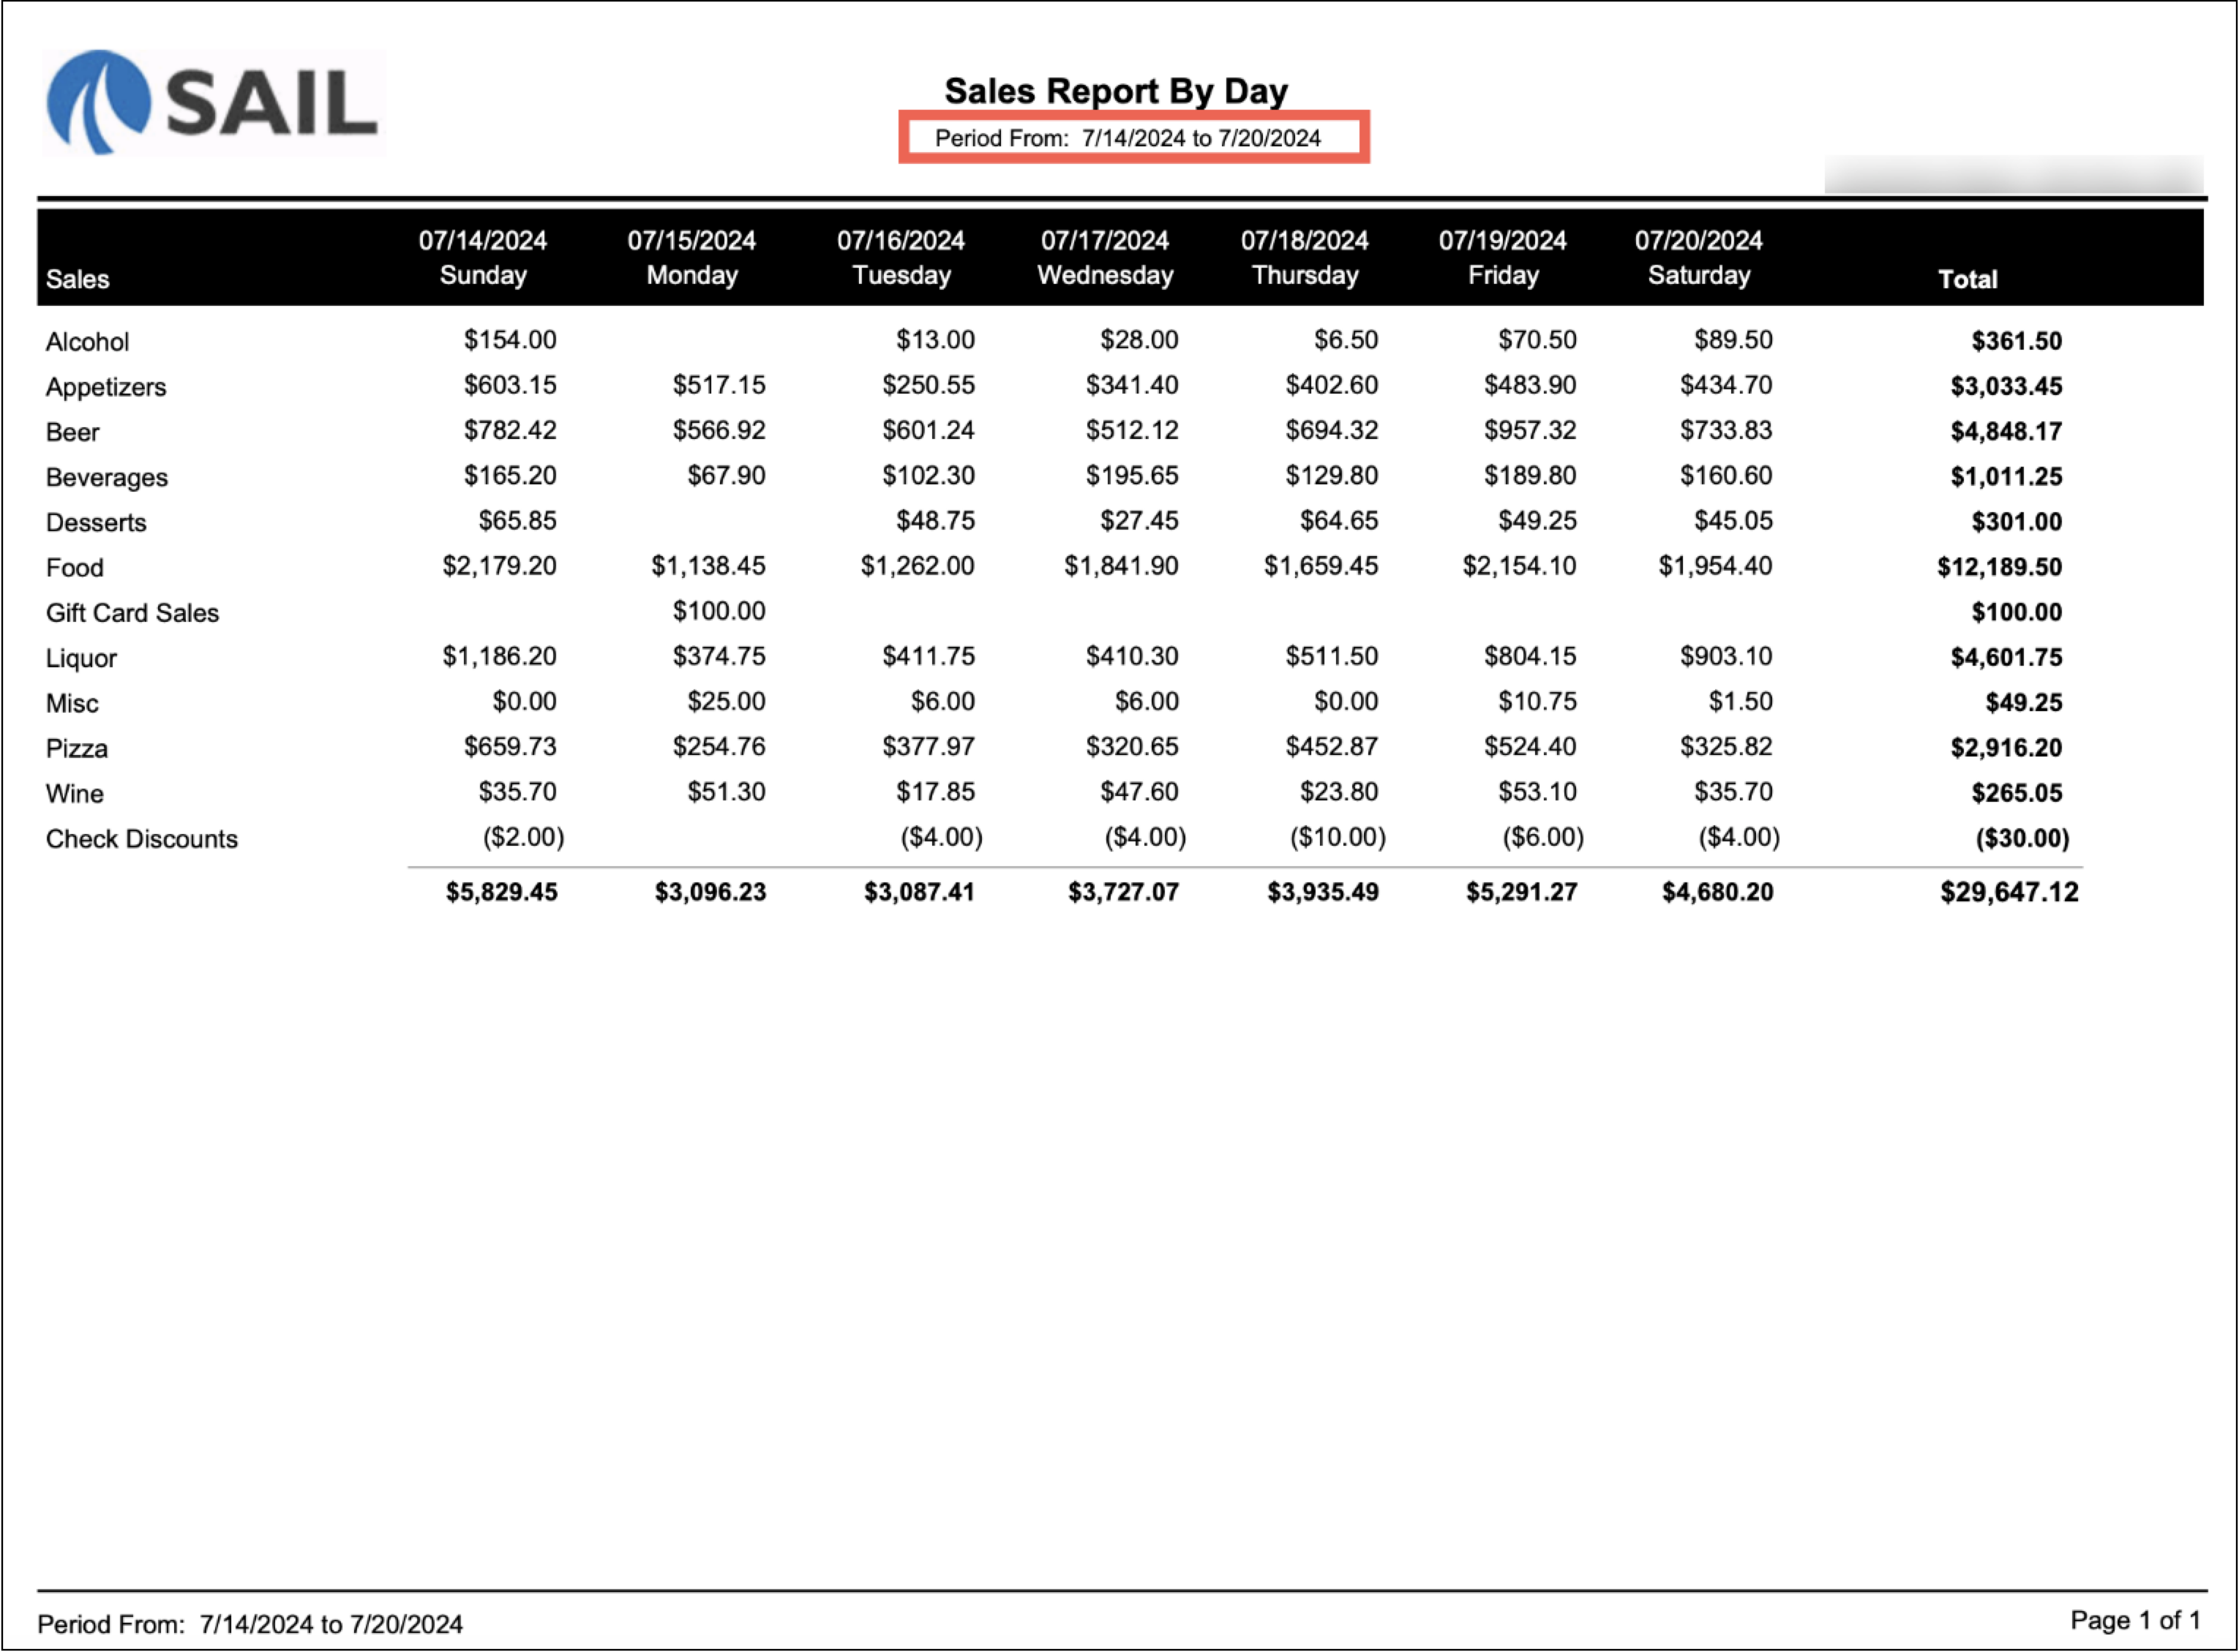
The Sales Report by Day lets you run sales for any date range and see net sales broken down by reporting group (Food, Liquor, Beer, etc.) across up to 7 day columns:
-
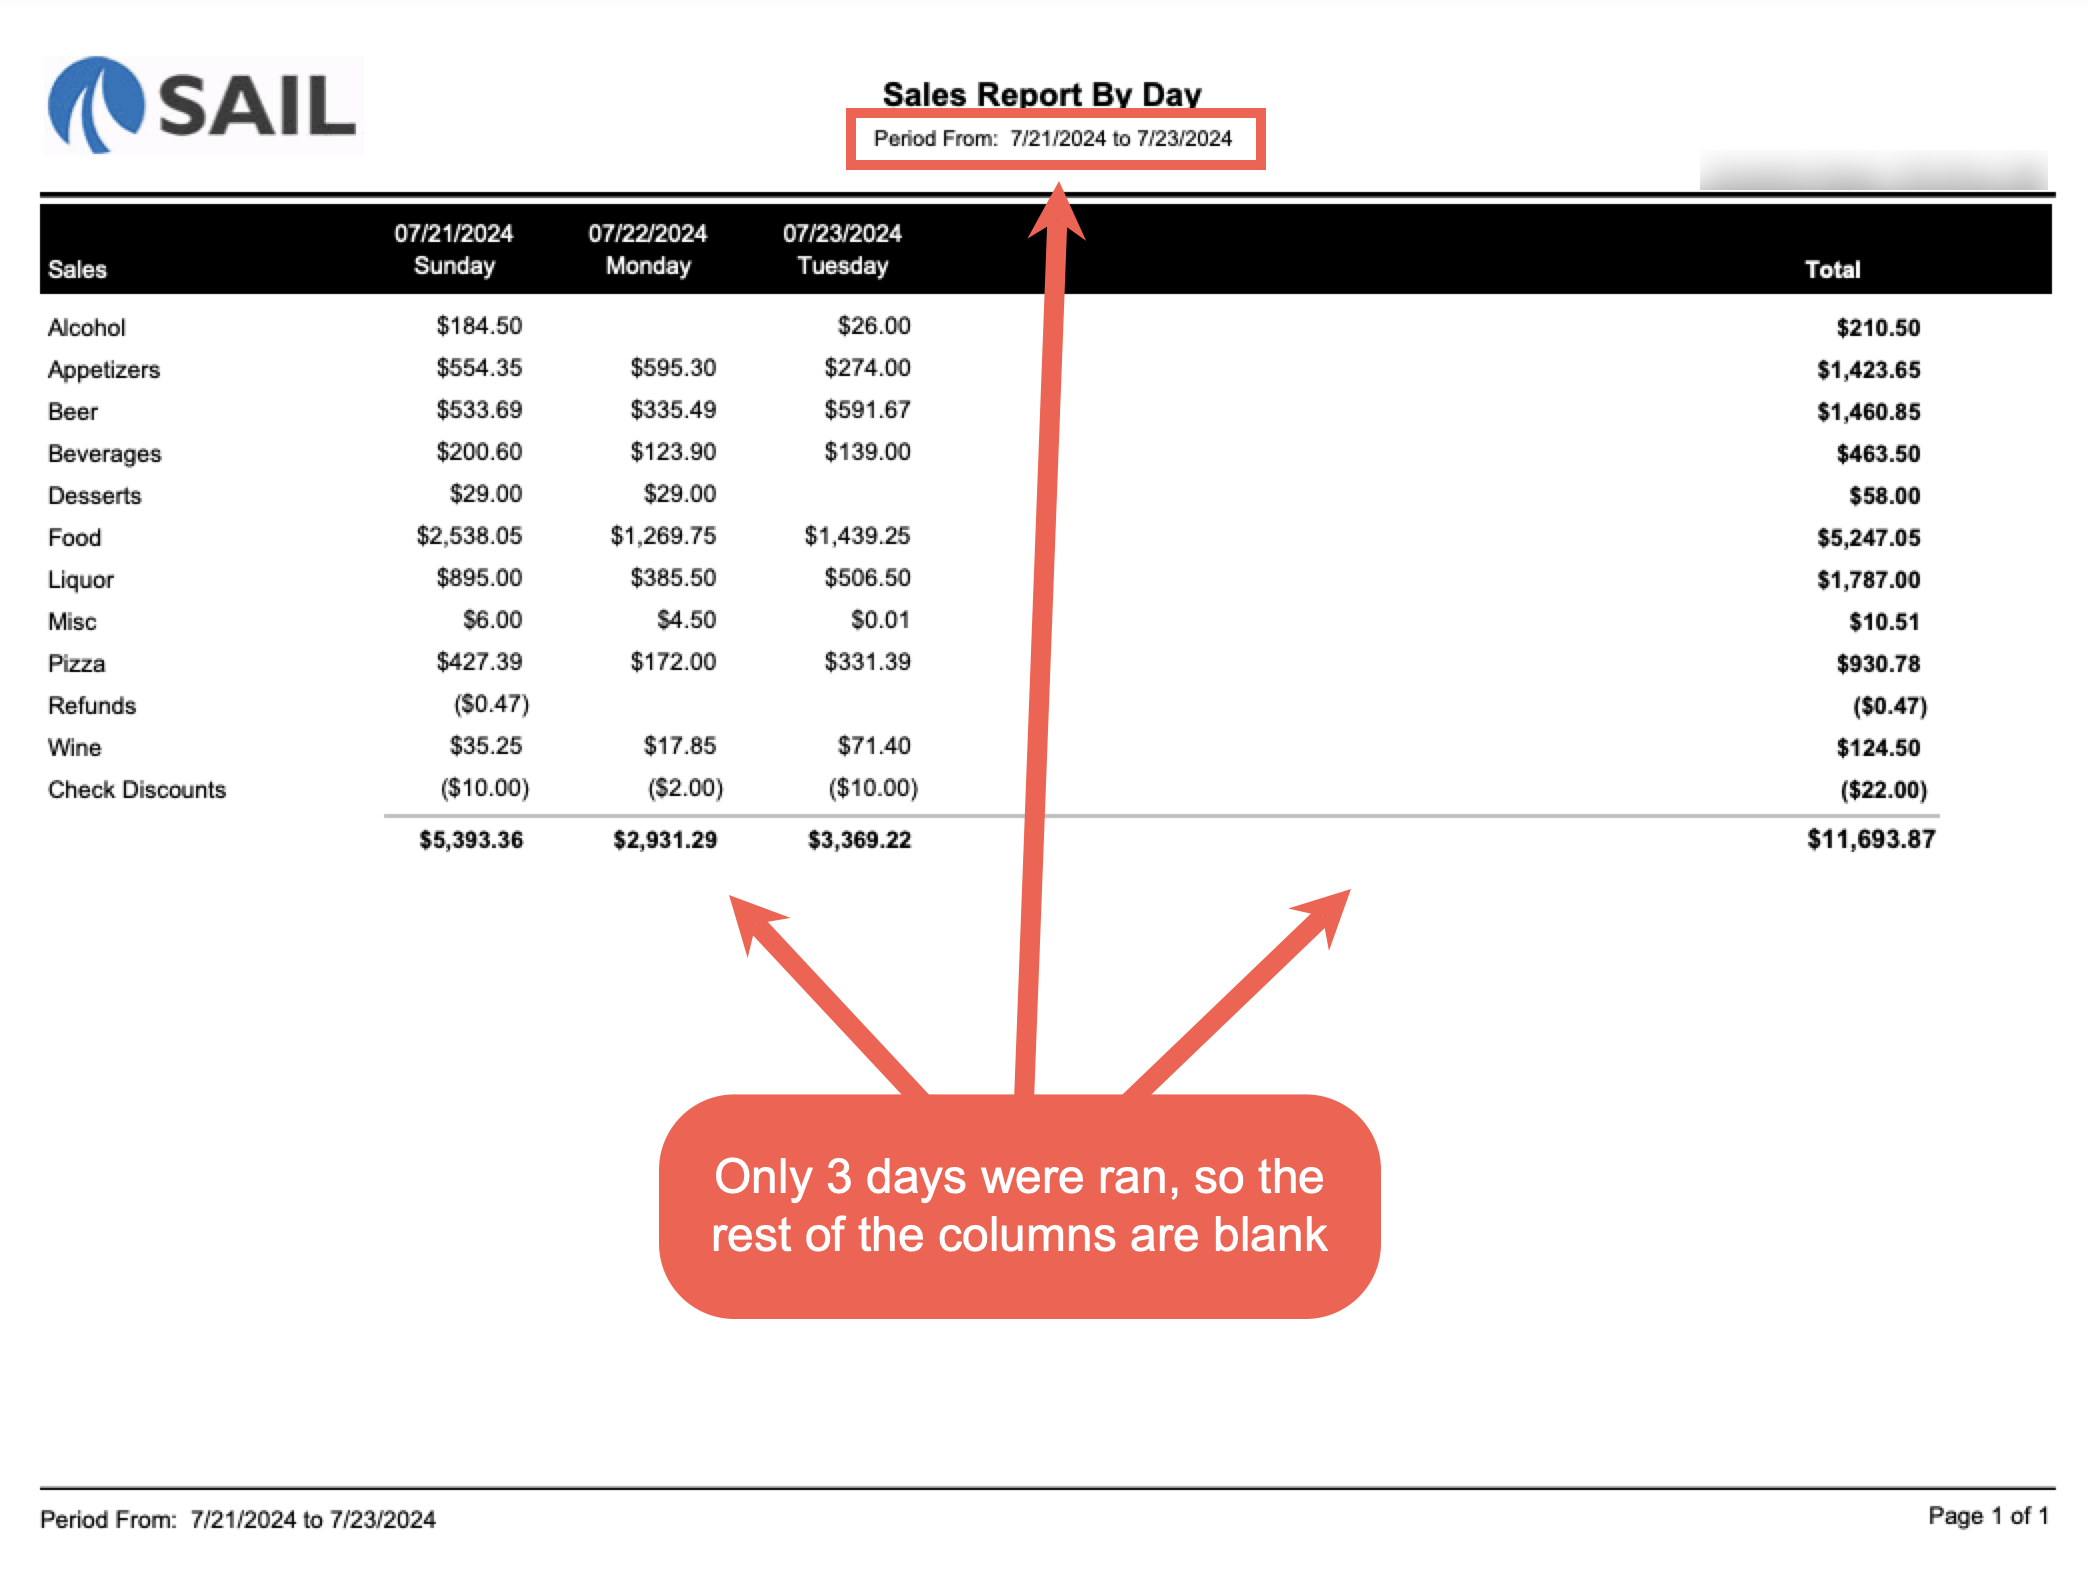
If you run it for fewer than 7 days, unused columns will be blank.
-
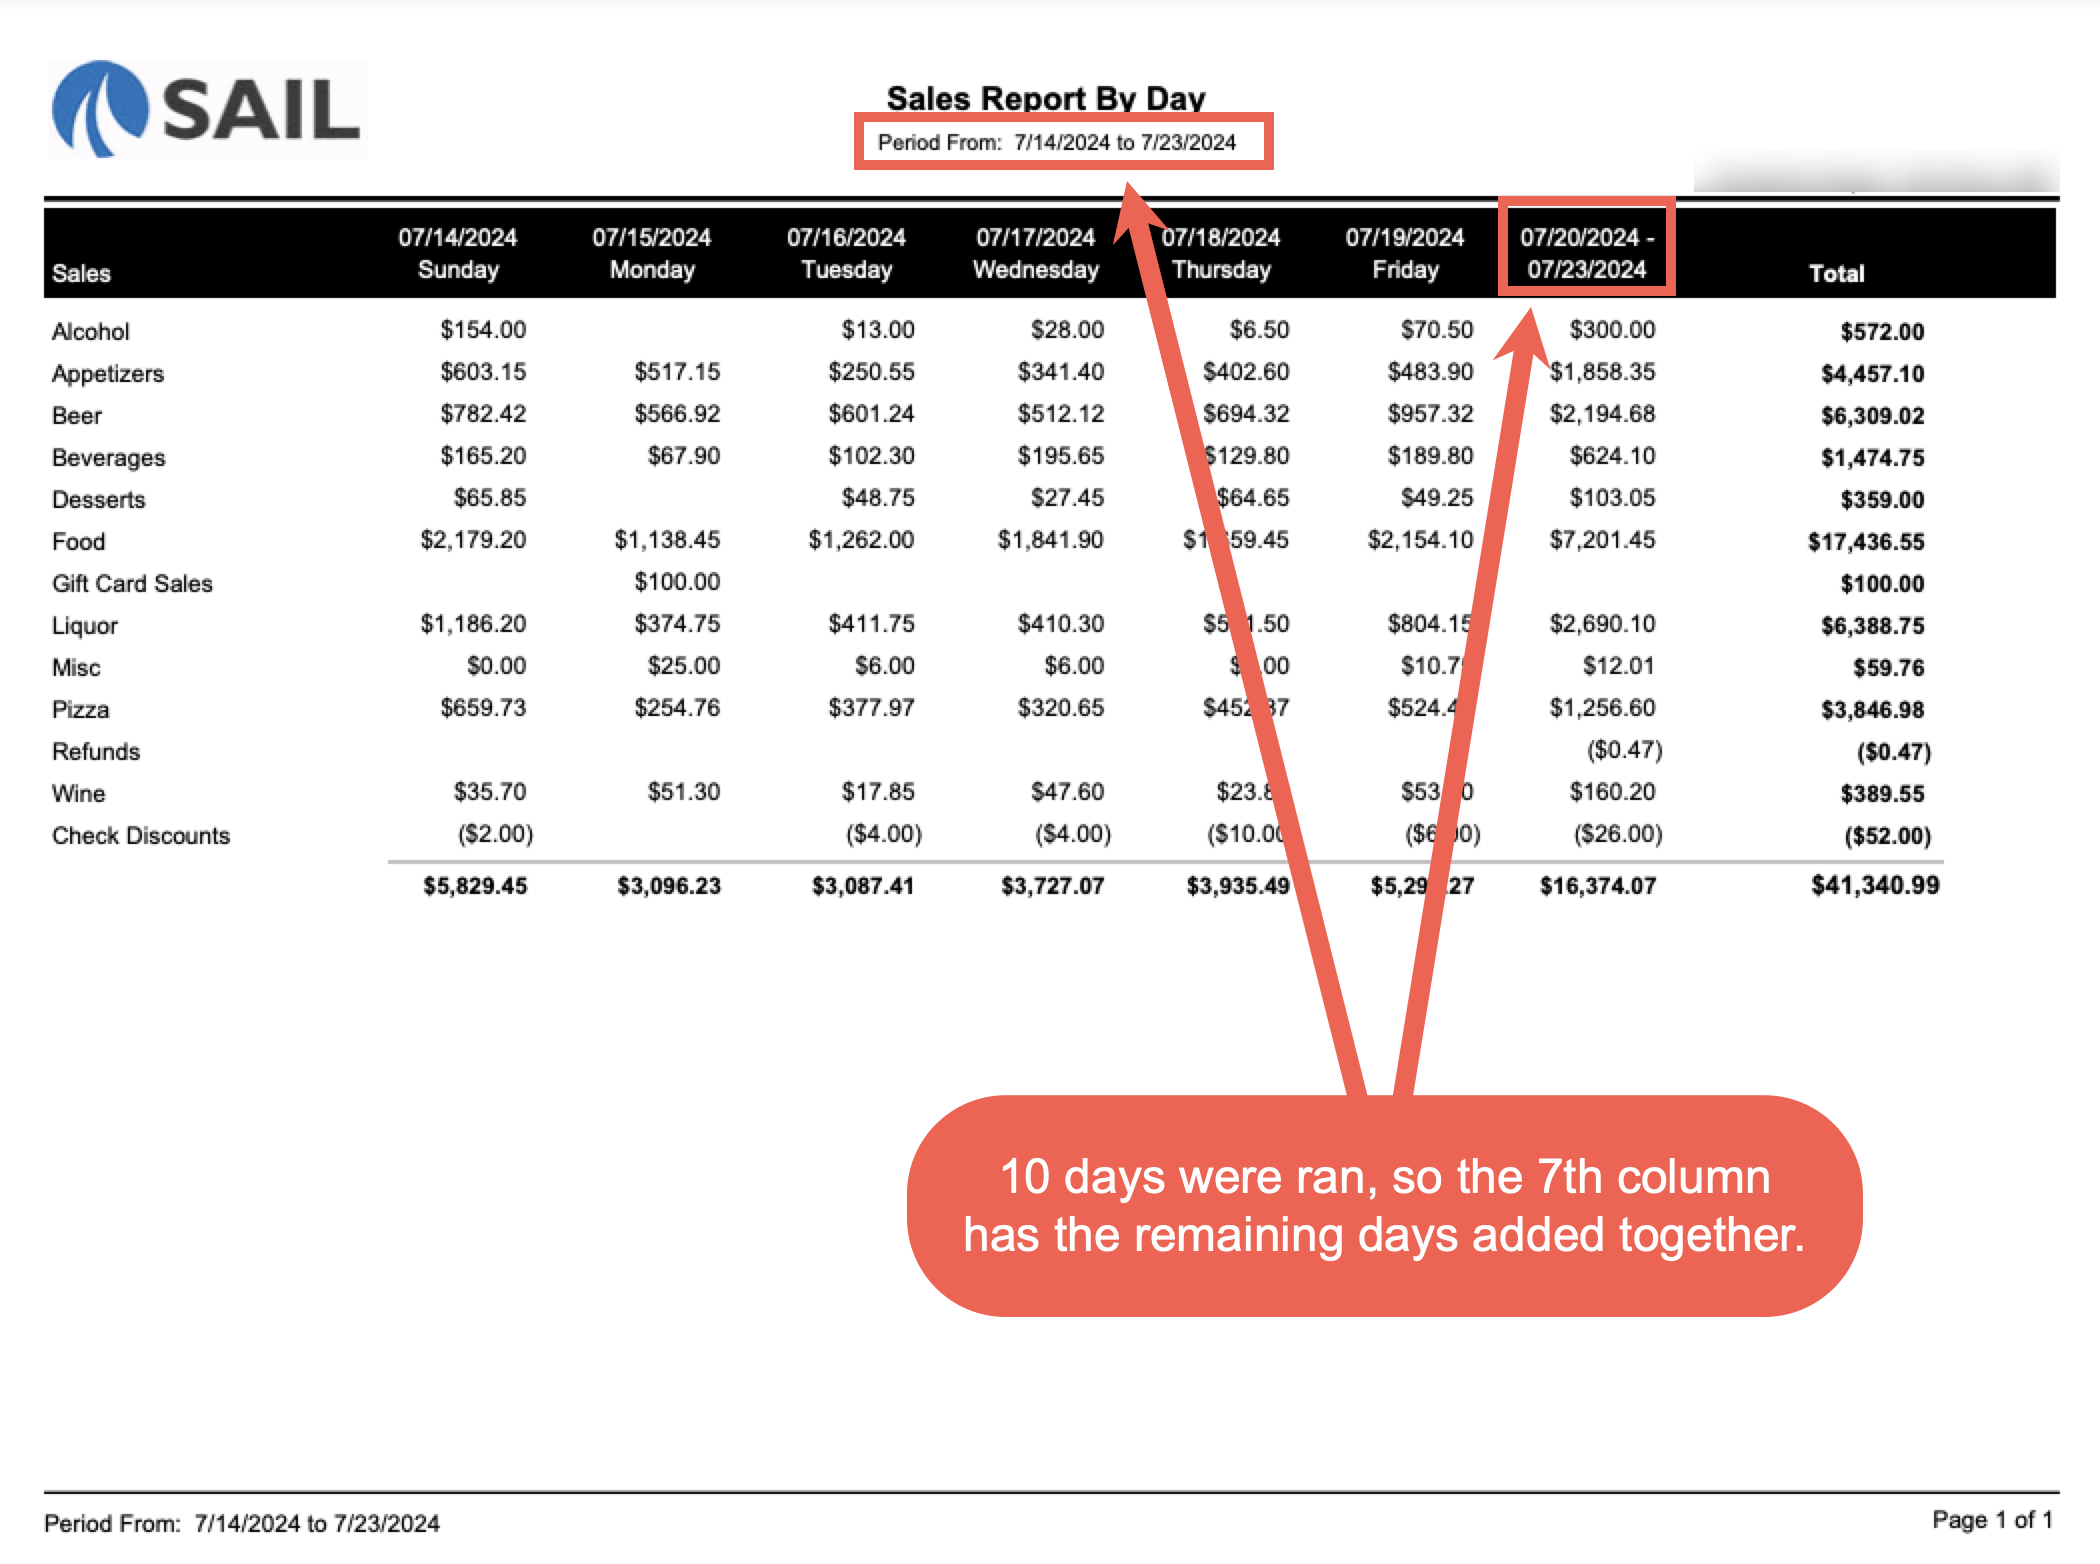
If you run it for more than 7 days, the first 6 columns show individual days, and the 7th column combines the remaining days into one total.
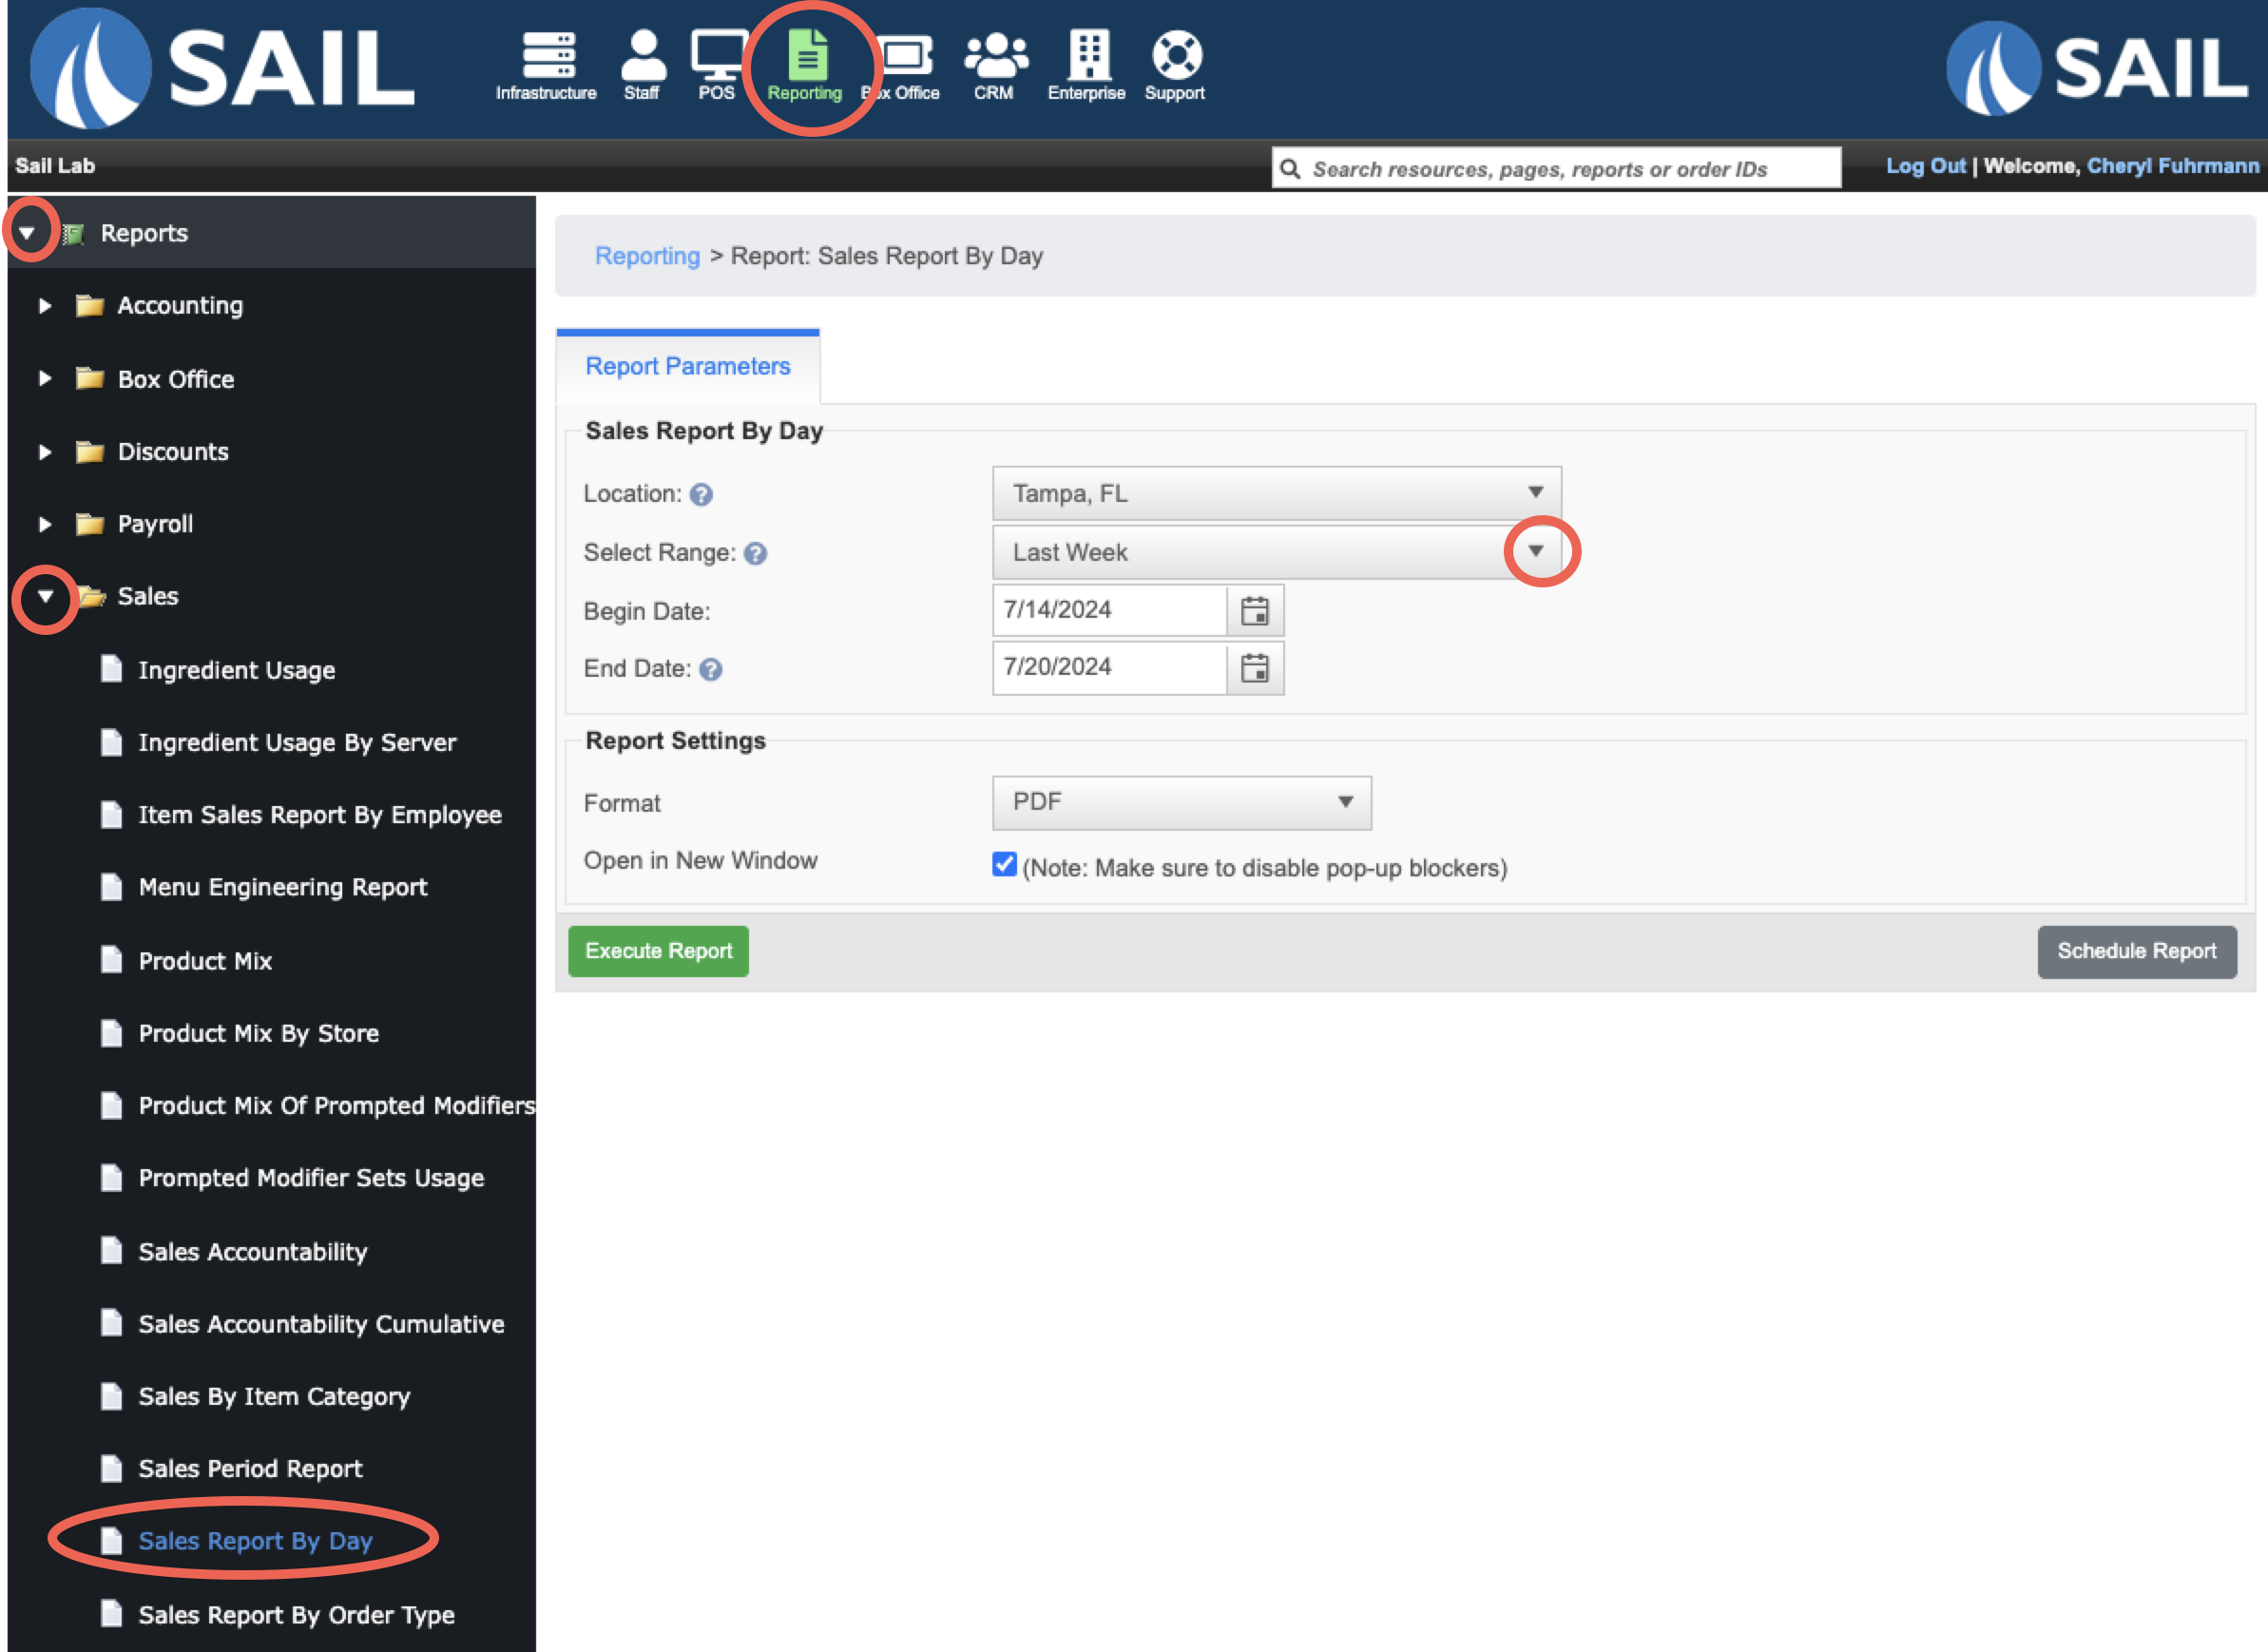
Where to find the report
- Backoffice --> Reporting --> Reports --> Sales folder --> Sales Report by Day --> Select Date Range --> Execute
What it looks like
Example #1 - Ran for 7 days
Example #2 - Ran for 3 days
Example #3 - Ran for 10 days
Report Parts
Report Structure
-
Rows – Each row is a sales category (Food, Pizza, Liquor, Beer, Wine, etc.).
-
Columns – Each column is a day in the selected date range.
-
Totals Row – At the bottom of each column, you’ll see total sales for the day.
-
Totals Column – On the far right, you’ll see total sales by category across the entire date range.
Column Explanations
-
Sales Column – The preconfigured reporting groups
-
Daily Columns (Dates) – Show how much was sold in each category on that specific day.
-
Total Column (far right) – The combined total for the entire reporting period by category.
-
Daily Totals Row (bottom) – Total sales for each individual day.
-
Grand Total (bottom right) – All sales across the reporting period.
How to Use This Report
-
Look across the days to spot your busiest day of the week.
-
Check which categories drive sales on each day (e.g., Beer might be higher on Fridays).
-
Use the Totals Column to see overall performance by category for the whole week or date range.
-
Compare daily totals at the bottom to verify with your Daily Sales Report.
-
Watch for negative numbers in “Check Discounts” to understand how much was discounted off sales.