
Sales vs Labor By Day Part Report
The Sales vs Labor By Day Part Report compares sales performance against labor costs, summarized by your preconfigured day parts (for example, Lunch and Dinner). It works similarly to the Sales vs Labor by Hour report, but instead of breaking data into time intervals, it rolls everything up into each day part — making it easy to see at a glance how efficiently labor is being used during each period of the day.
Where to find the report
- Backoffice --> Reporting --> Reports --> Sales folder --> Sales vs Labor By Day Part --> Select Date Range --> Execute
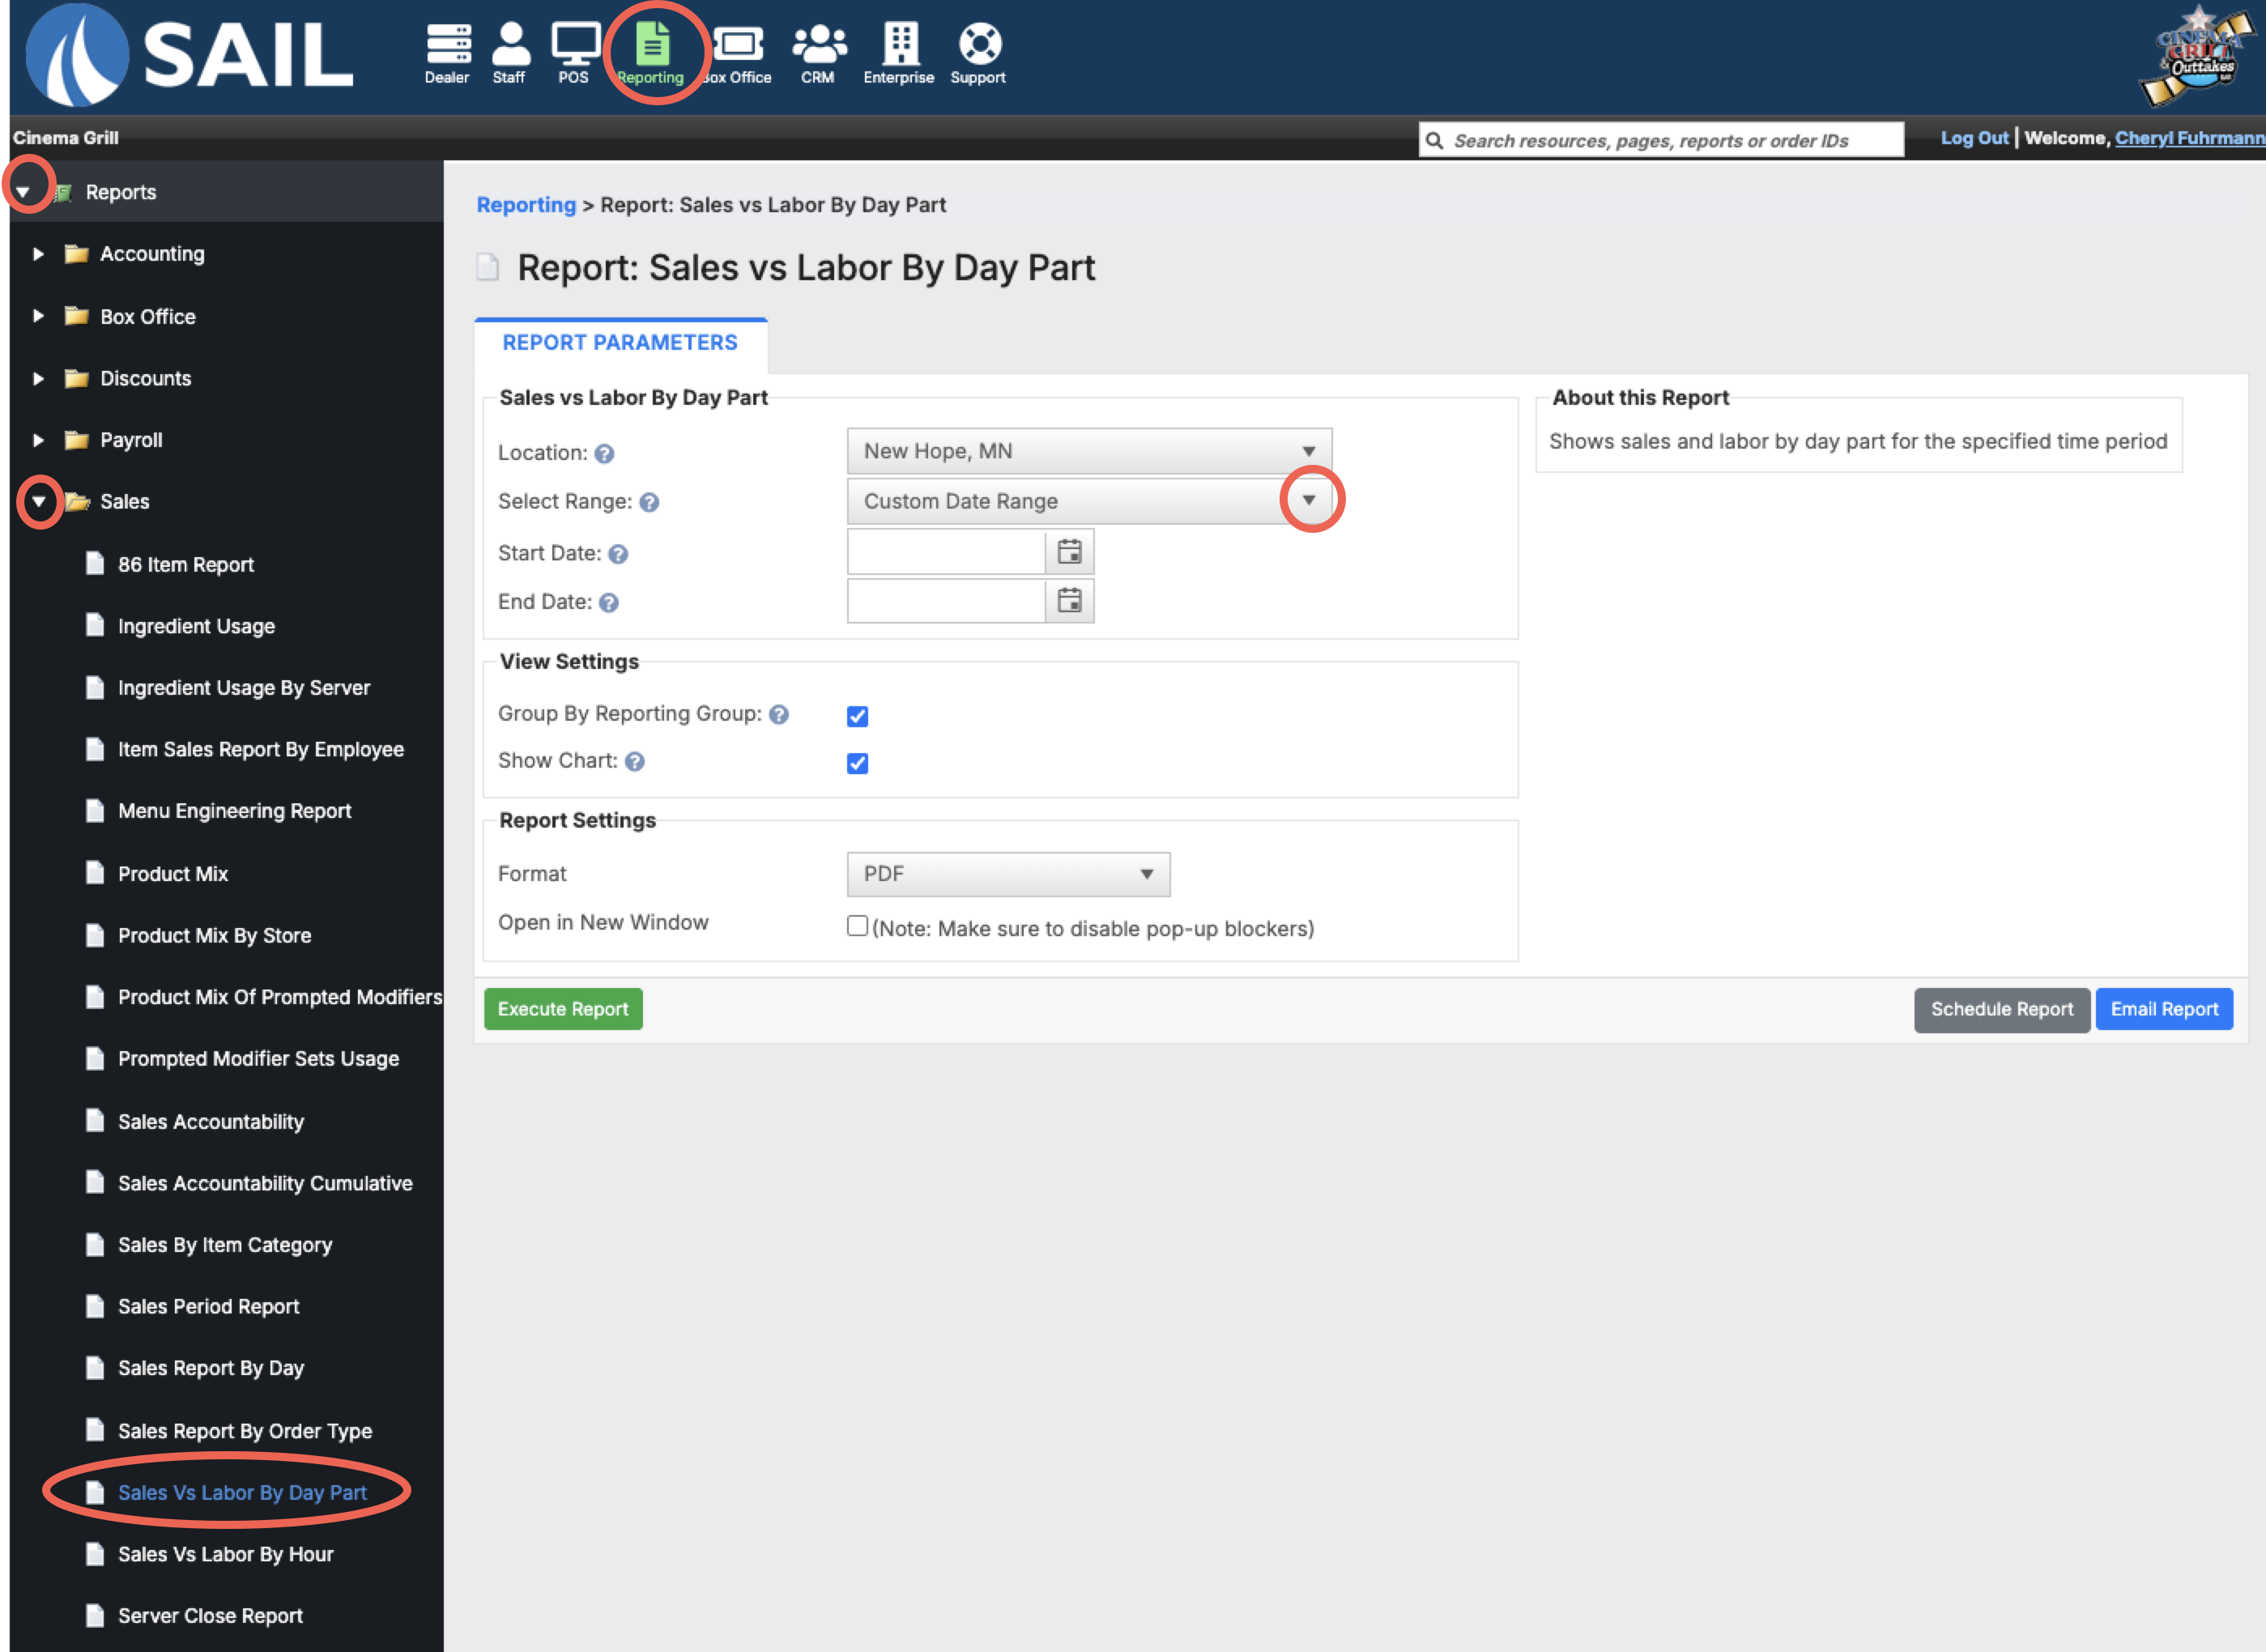
Report Options
View Settings
-
Group by Reporting Group – When enabled, each day part section includes a breakdown of Net Sales and Items by reporting group.
-
Show Chart – Adds a bar chart at the top comparing Net Sales, Labor Cost, and Labor $/Net across all day parts visually.
What it looks like
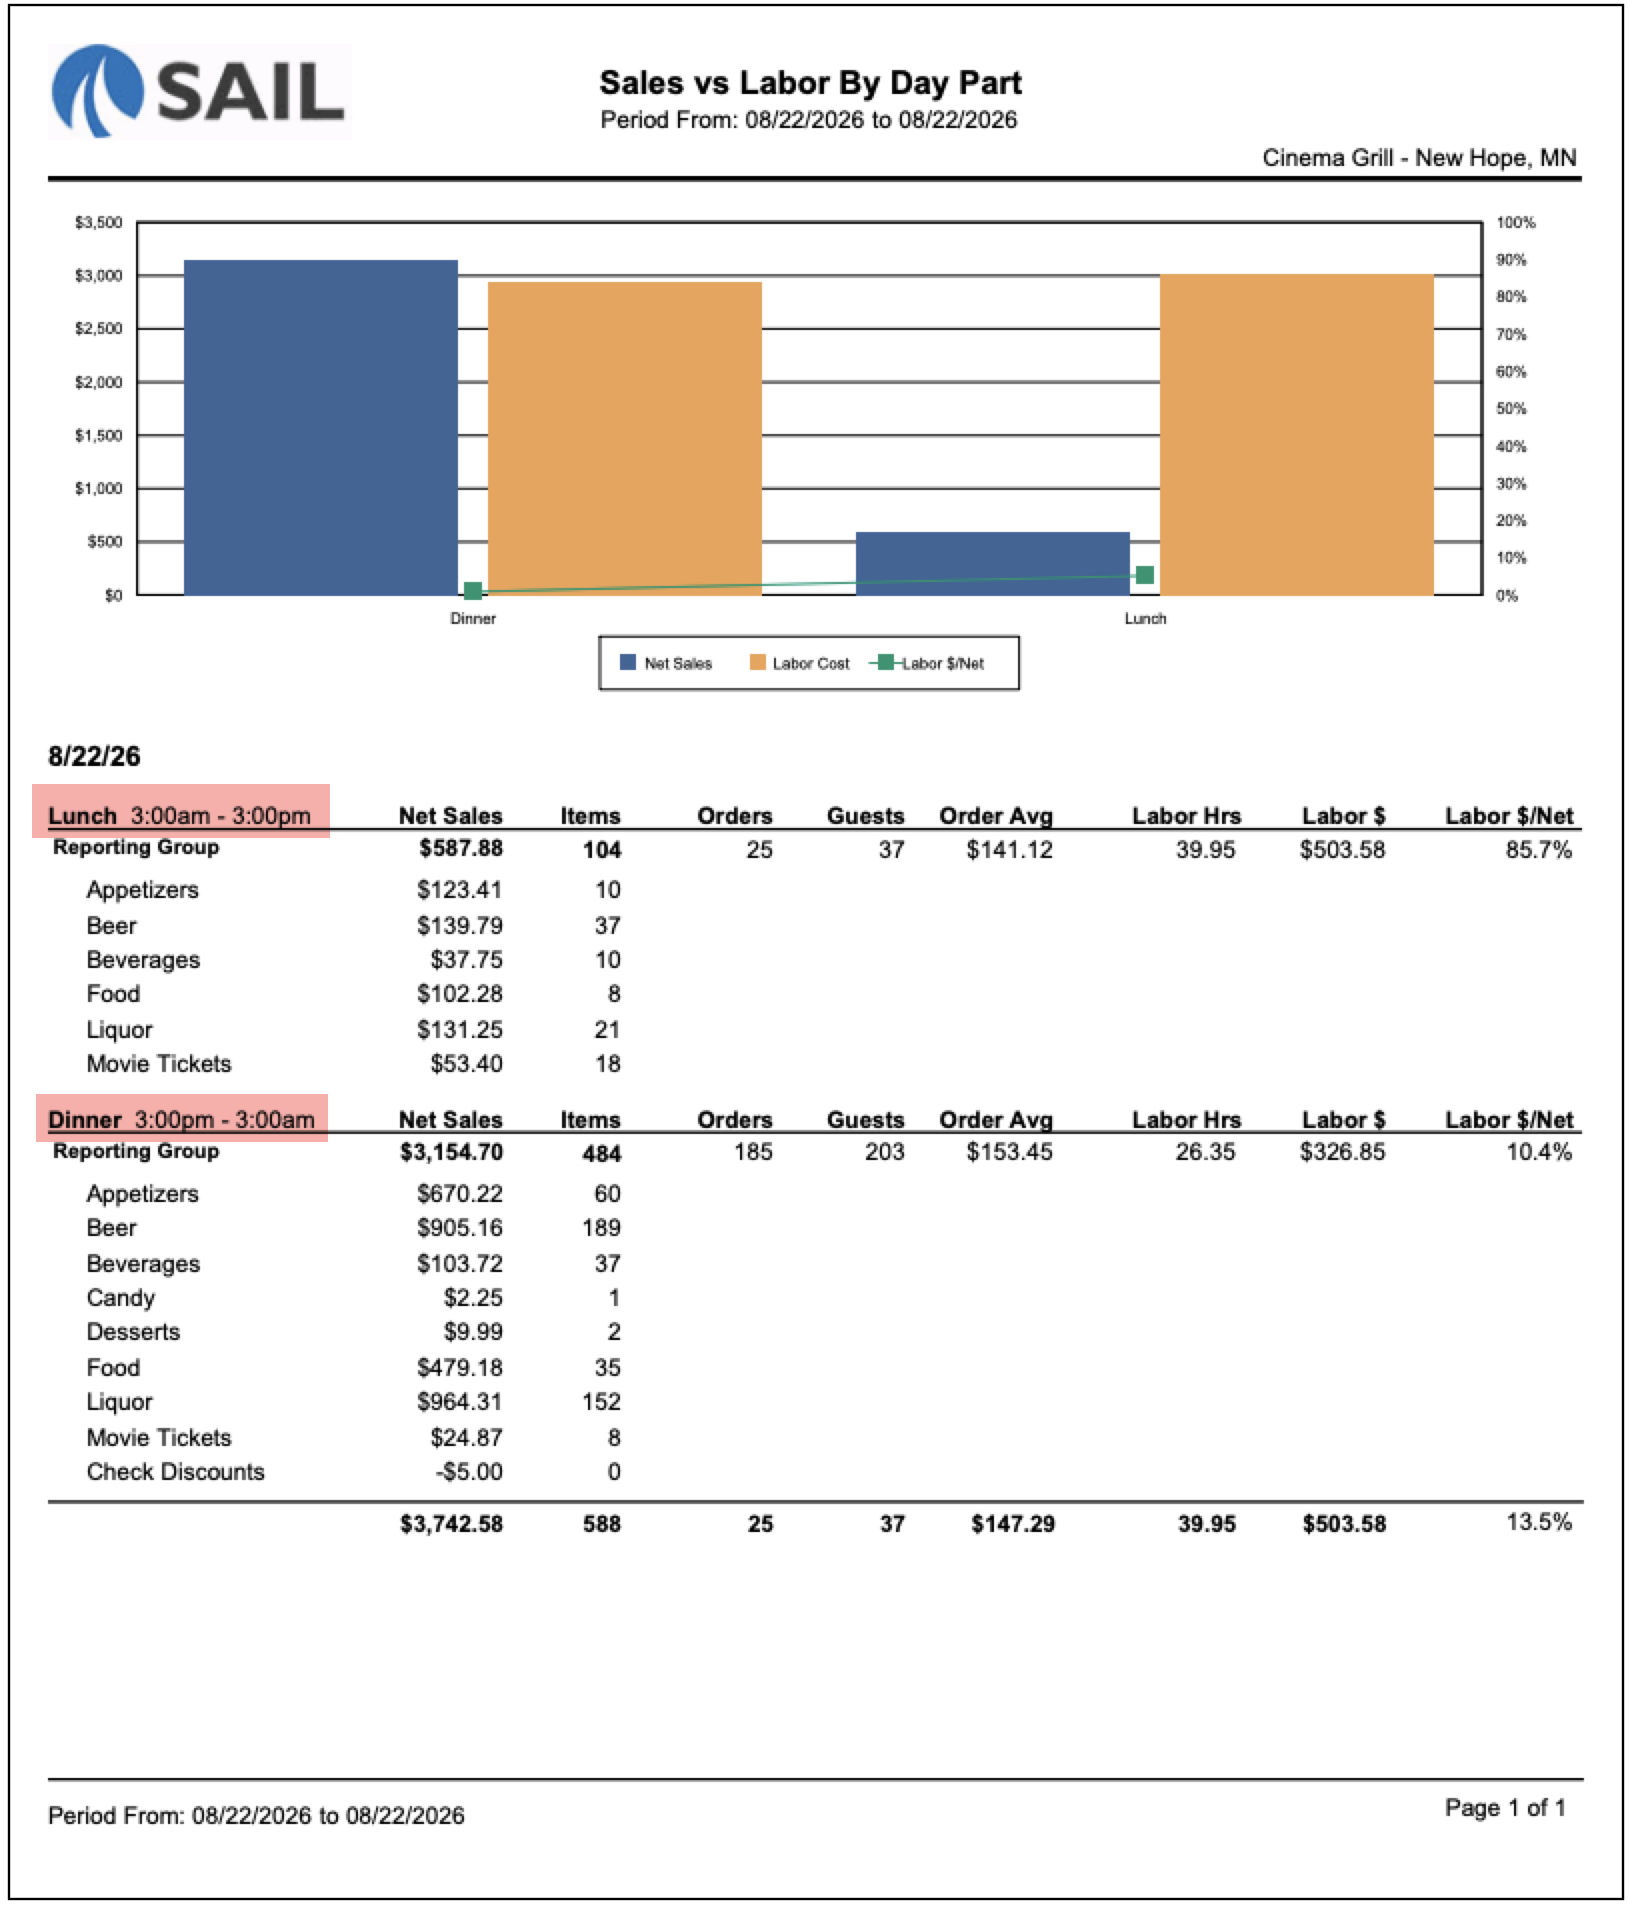
Report Parts
Chart Section (Top)
The bar chart visually compares each day part side by side:
- Net Sales (blue bars) – Total sales for each day part.
- Labor Cost (orange bars) – Total labor cost during each day part.
- Labor $/Net (green line, right axis) – Labor cost as a percentage of sales for each day part.
This makes it easy to spot which day parts are most and least efficient from a labor-to-sales perspective.
Table Section (Bottom)
The report is organized by date. Under each date, one section appears per day part.
Each day part header shows the day part name and its configured time range (e.g., Lunch 3:00am – 3:00pm).
Here's what each column means:
- Net Sales – Total sales made during that day part.
- Items – Total number of items sold during that day part.
- Orders – Total number of orders completed during that day part.
- Guests – Total guest count entered during that day part.
- Order Avg – Average amount spent per order. Calculated as Net Sales ÷ Orders.
- Labor Hrs – Total employee hours worked during that day part.
- Labor $ – Total labor cost for that day part, based on hours worked multiplied by hourly rates.
- Labor $/Net – Labor cost as a percentage of sales for that day part. Calculated as Labor $ ÷ Net Sales × 100.
A grand total row at the bottom summarizes all day parts combined for the selected date range.
*Optional Reporting Group Breakdown
If Group by Reporting Group is selected, each day part section will include a breakdown of sales by reporting group.
- Only reporting groups that had sales during that specific day part will be displayed.
- Each reporting group shows:
- Net Sales – Total sales for that reporting group during the day part.
- Items – Number of items sold from that reporting group during the day part.
- Reporting group totals add up to the Net Sales and Item count shown in the day part summary row.
Day parts are preconfigured in Backoffice. The time ranges shown in each section header reflect your location's day part configuration.
How to Use This Report
- Compare labor efficiency across day parts to see which periods have the best and worst labor-to-sales ratios.
- Use the Labor $/Net column to identify day parts where labor costs are disproportionately high relative to sales.
- Enable Group by Reporting Group to see which product categories are driving sales during each day part.
- Use the chart to get a quick visual read on which day parts are your strongest and weakest performers.
- Run this report alongside the Sales vs Labor by Hour report when you need a high-level day-part summary instead of a granular time-block breakdown.
- Use findings to adjust staffing levels — reduce coverage during low-sales day parts and increase it during high-volume ones.
- Use the Schedule Report or Email Report options to send this report to managers on a regular cadence.