
Sales vs Labor by Hour Report
The Sales vs Labor by Hour Report compares hourly sales performance against labor costs, helping you visualize how efficiently labor is being used throughout the day.
You can choose to view the data by hour, half-hour, or quarter-hour, depending on how detailed you want the breakdown to be.
The report will automatically start at the time of the first clock-in or first sale of the day, and end at the last clock-out or last sale, ensuring it captures the entire operating window.
Where to find the report
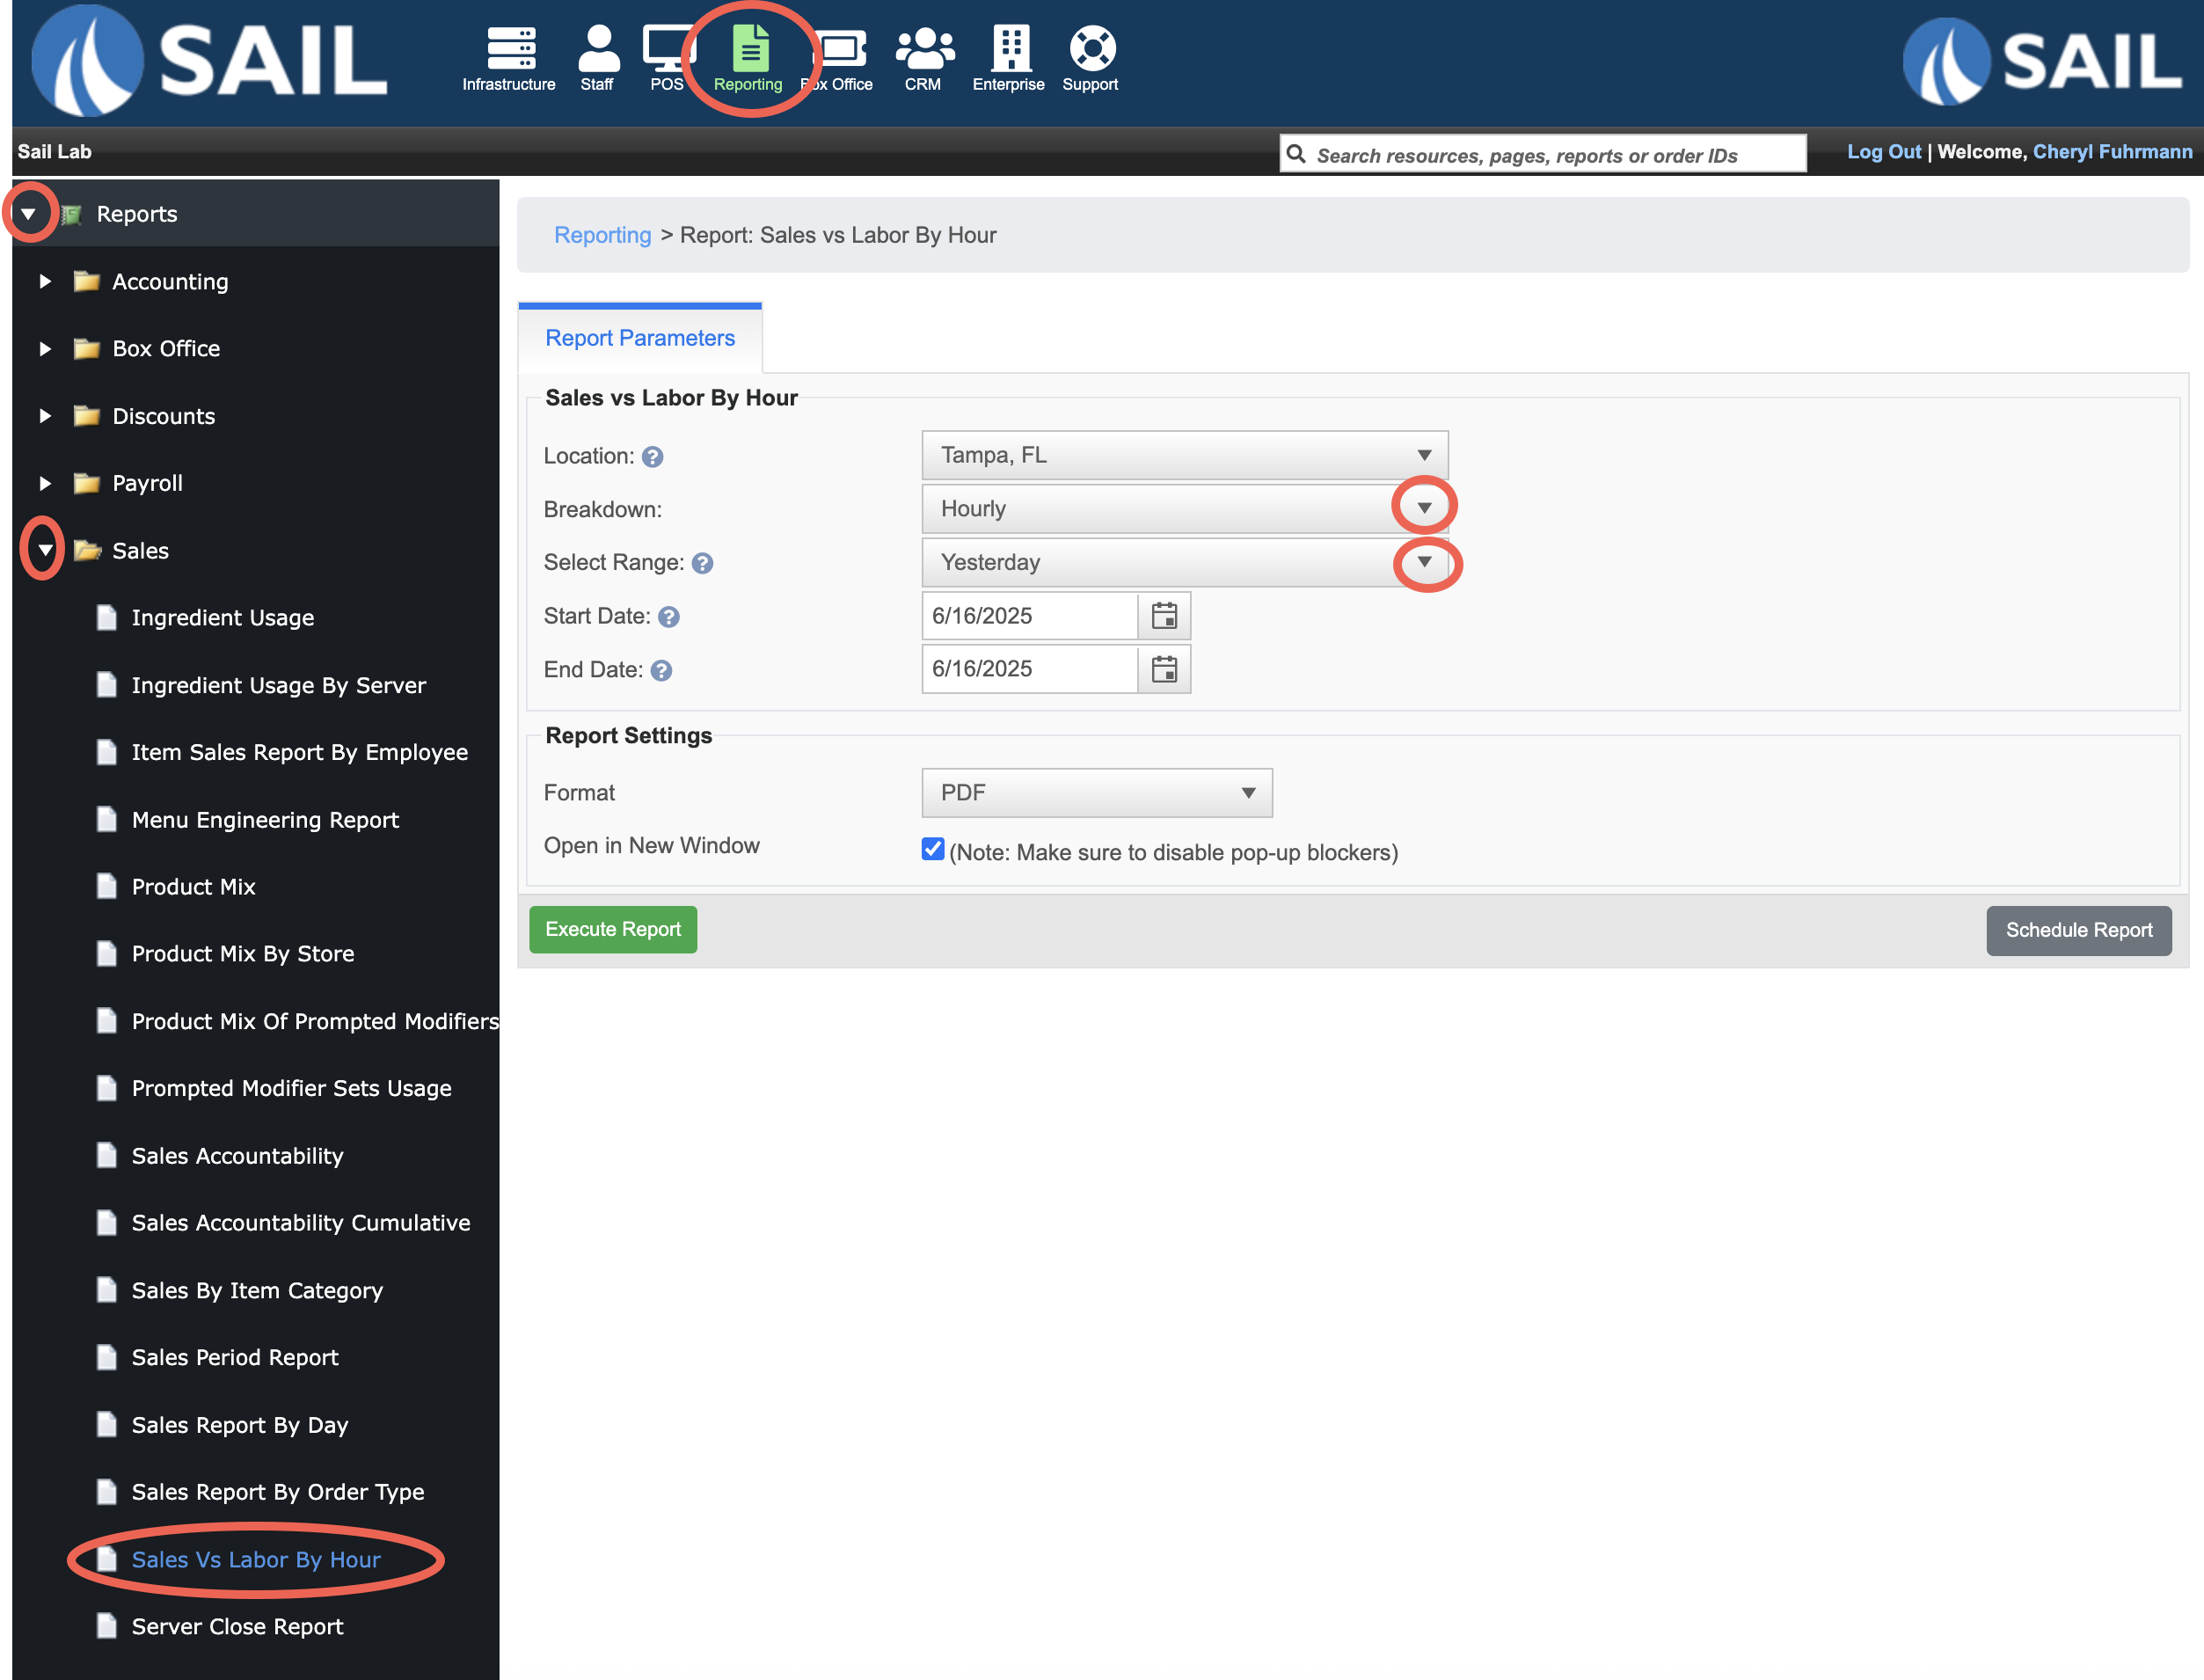
- Backoffice --> Reporting --> Reports --> Sales folder --> Sales vs Labor by Hour --> Time Breakdown --> Select Date Range --> Execute
Report Options
Breakdown
- Breakdown - Allows you to select if you'd like to view the data by hour, half-hour, or quarter-hour
What it looks like
Report Parts
Chart Section (Top)
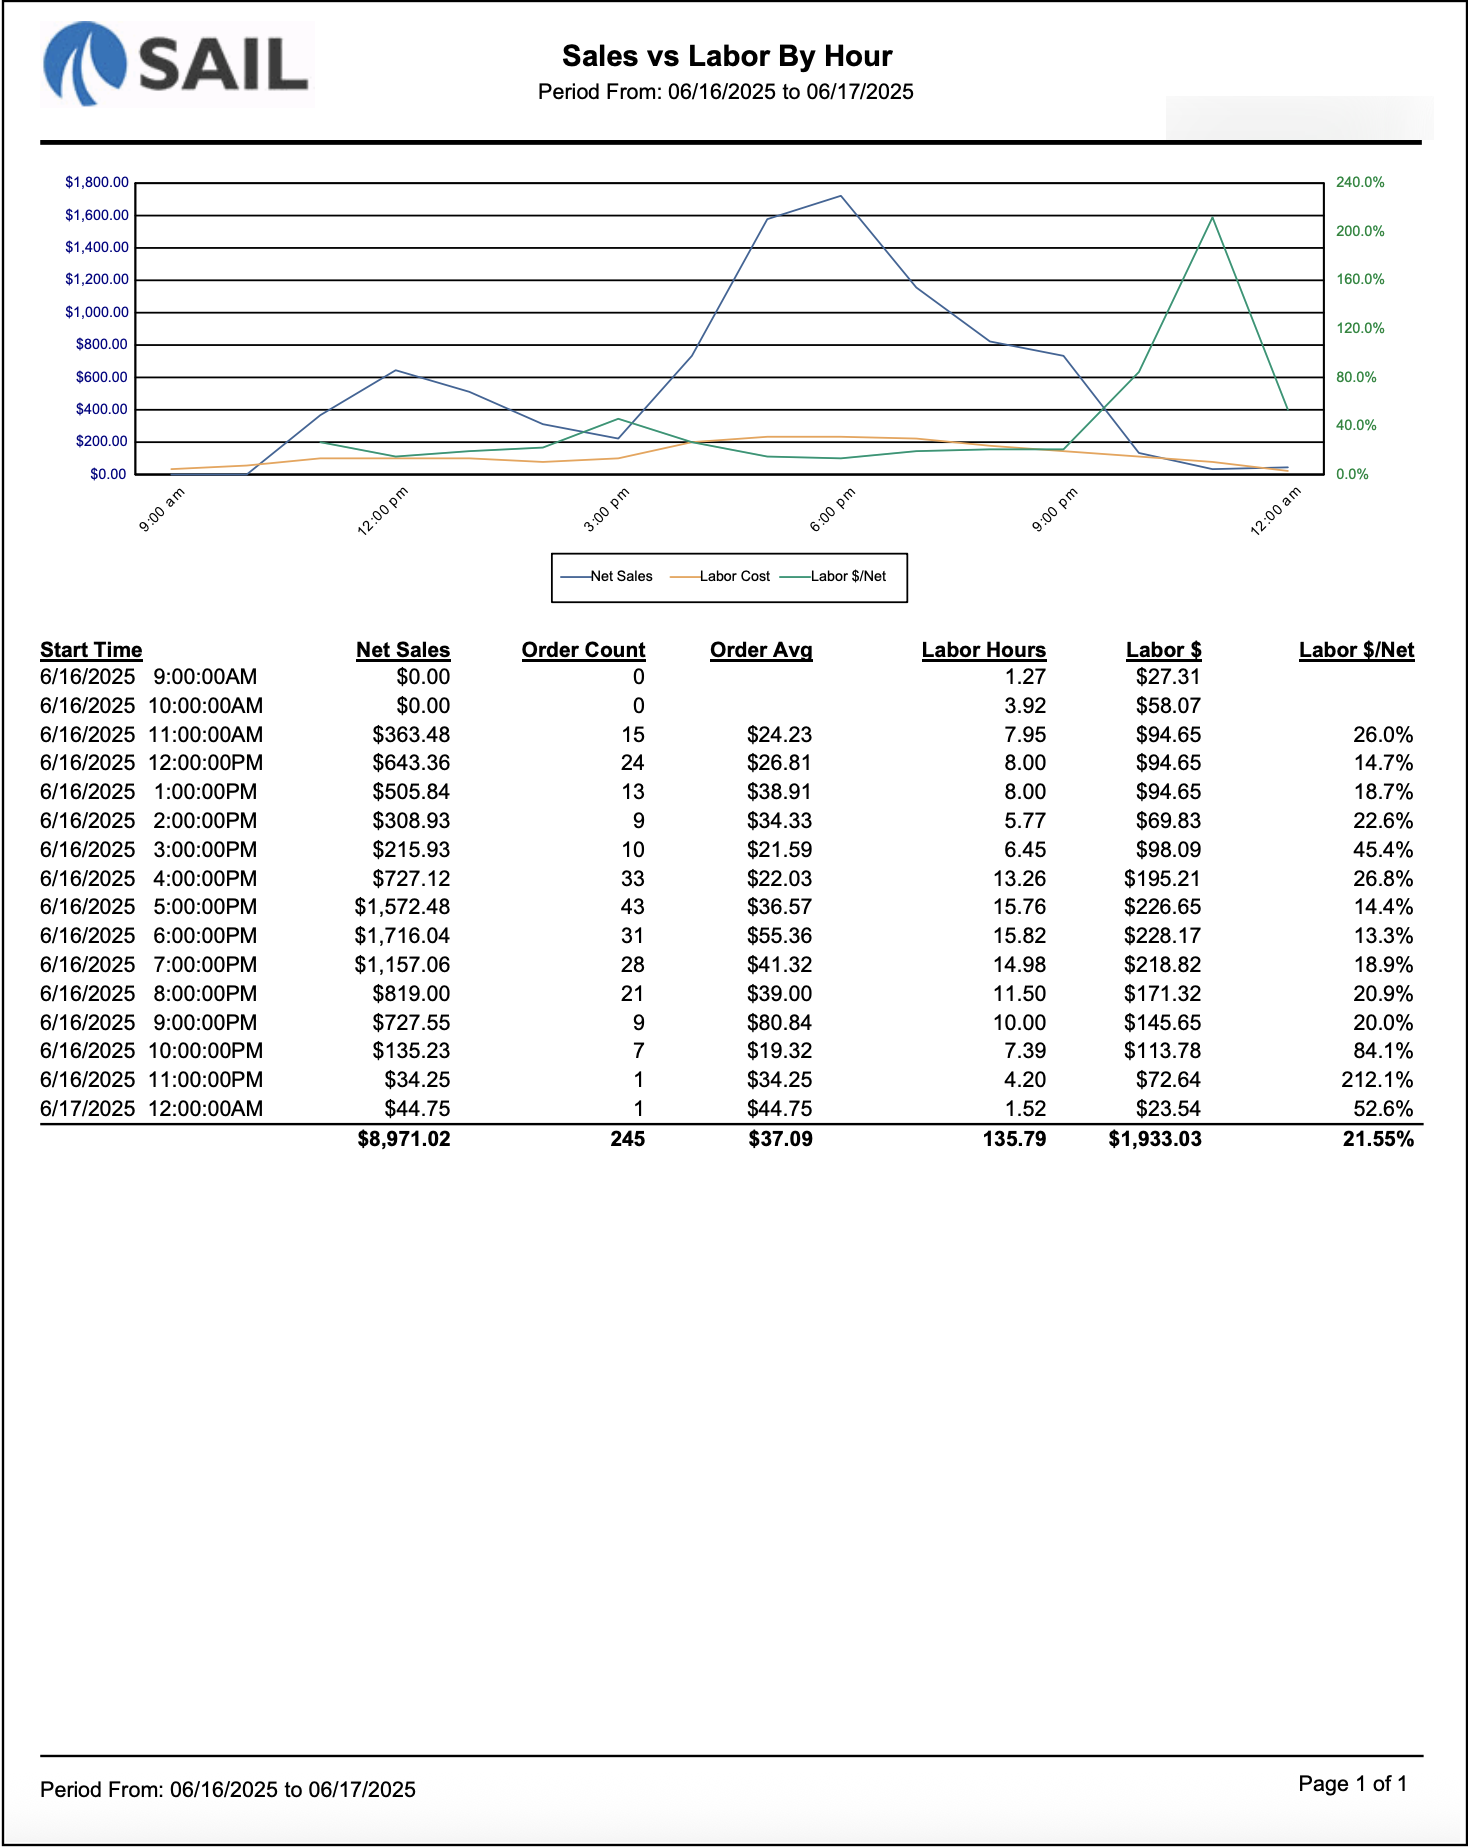
The line graph visually compares:
-
Net Sales (blue line) – Total sales for each time block.
-
Labor Cost (orange line) – Total cost of labor during that time.
-
Labor % of Net (green line, right axis) – Labor cost as a percentage of sales.
This helps identify peak sales hours and times when labor costs may be higher than necessary.
Table Section (Bottom)
Each row represents one time interval (hour, half-hour, or quarter-hour).
Here’s what each column means
-
Start Time – Shows the beginning of the time block being measured.
-
Net Sales – Displays the total sales made during that specific time period.
-
Order Count – Shows how many individual orders were completed during that time block.
-
Order Avg – The average amount spent per order. This is calculated by dividing Net Sales ÷ Order Count.
-
Labor Hours – The total number of employee hours worked during that time.
-
Labor $ – The total labor cost for that period, based on employee hours multiplied by their hourly rate.
-
Labor %/Net – Shows labor cost as a percentage of sales for that time frame. This is calculated by dividing Labor $ ÷ Net Sales × 100.
A summary row at the bottom shows total sales, total orders, total labor hours, total labor cost, and overall labor percentage for the day.
How to Use This Report
-
Identify busy vs. slow periods to make better staffing decisions.
-
Track how well labor hours align with peak sales times.
-
Spot overstaffed or understaffed periods by comparing labor cost to sales volume.
-
Evaluate average order value across the day to see if sales patterns shift by time of day.
-
Use this report to plan future schedules — aim to reduce labor cost during slow times and increase coverage during busy times.