
Driver Report
The Handheld Usage helps measure handheld adoption by comparing employee sales activity on handheld devices versus POS terminals.
Use this report to identify which employees are actively using handhelds, monitor adoption across locations, and track how much of a store's sales activity is being performed on handheld devices versus traditional terminals.
Where to find the report
- Backoffice --> Reporting --> Reports --> Staff folder --> Handheld Usage --> Select Date Range --> Execute
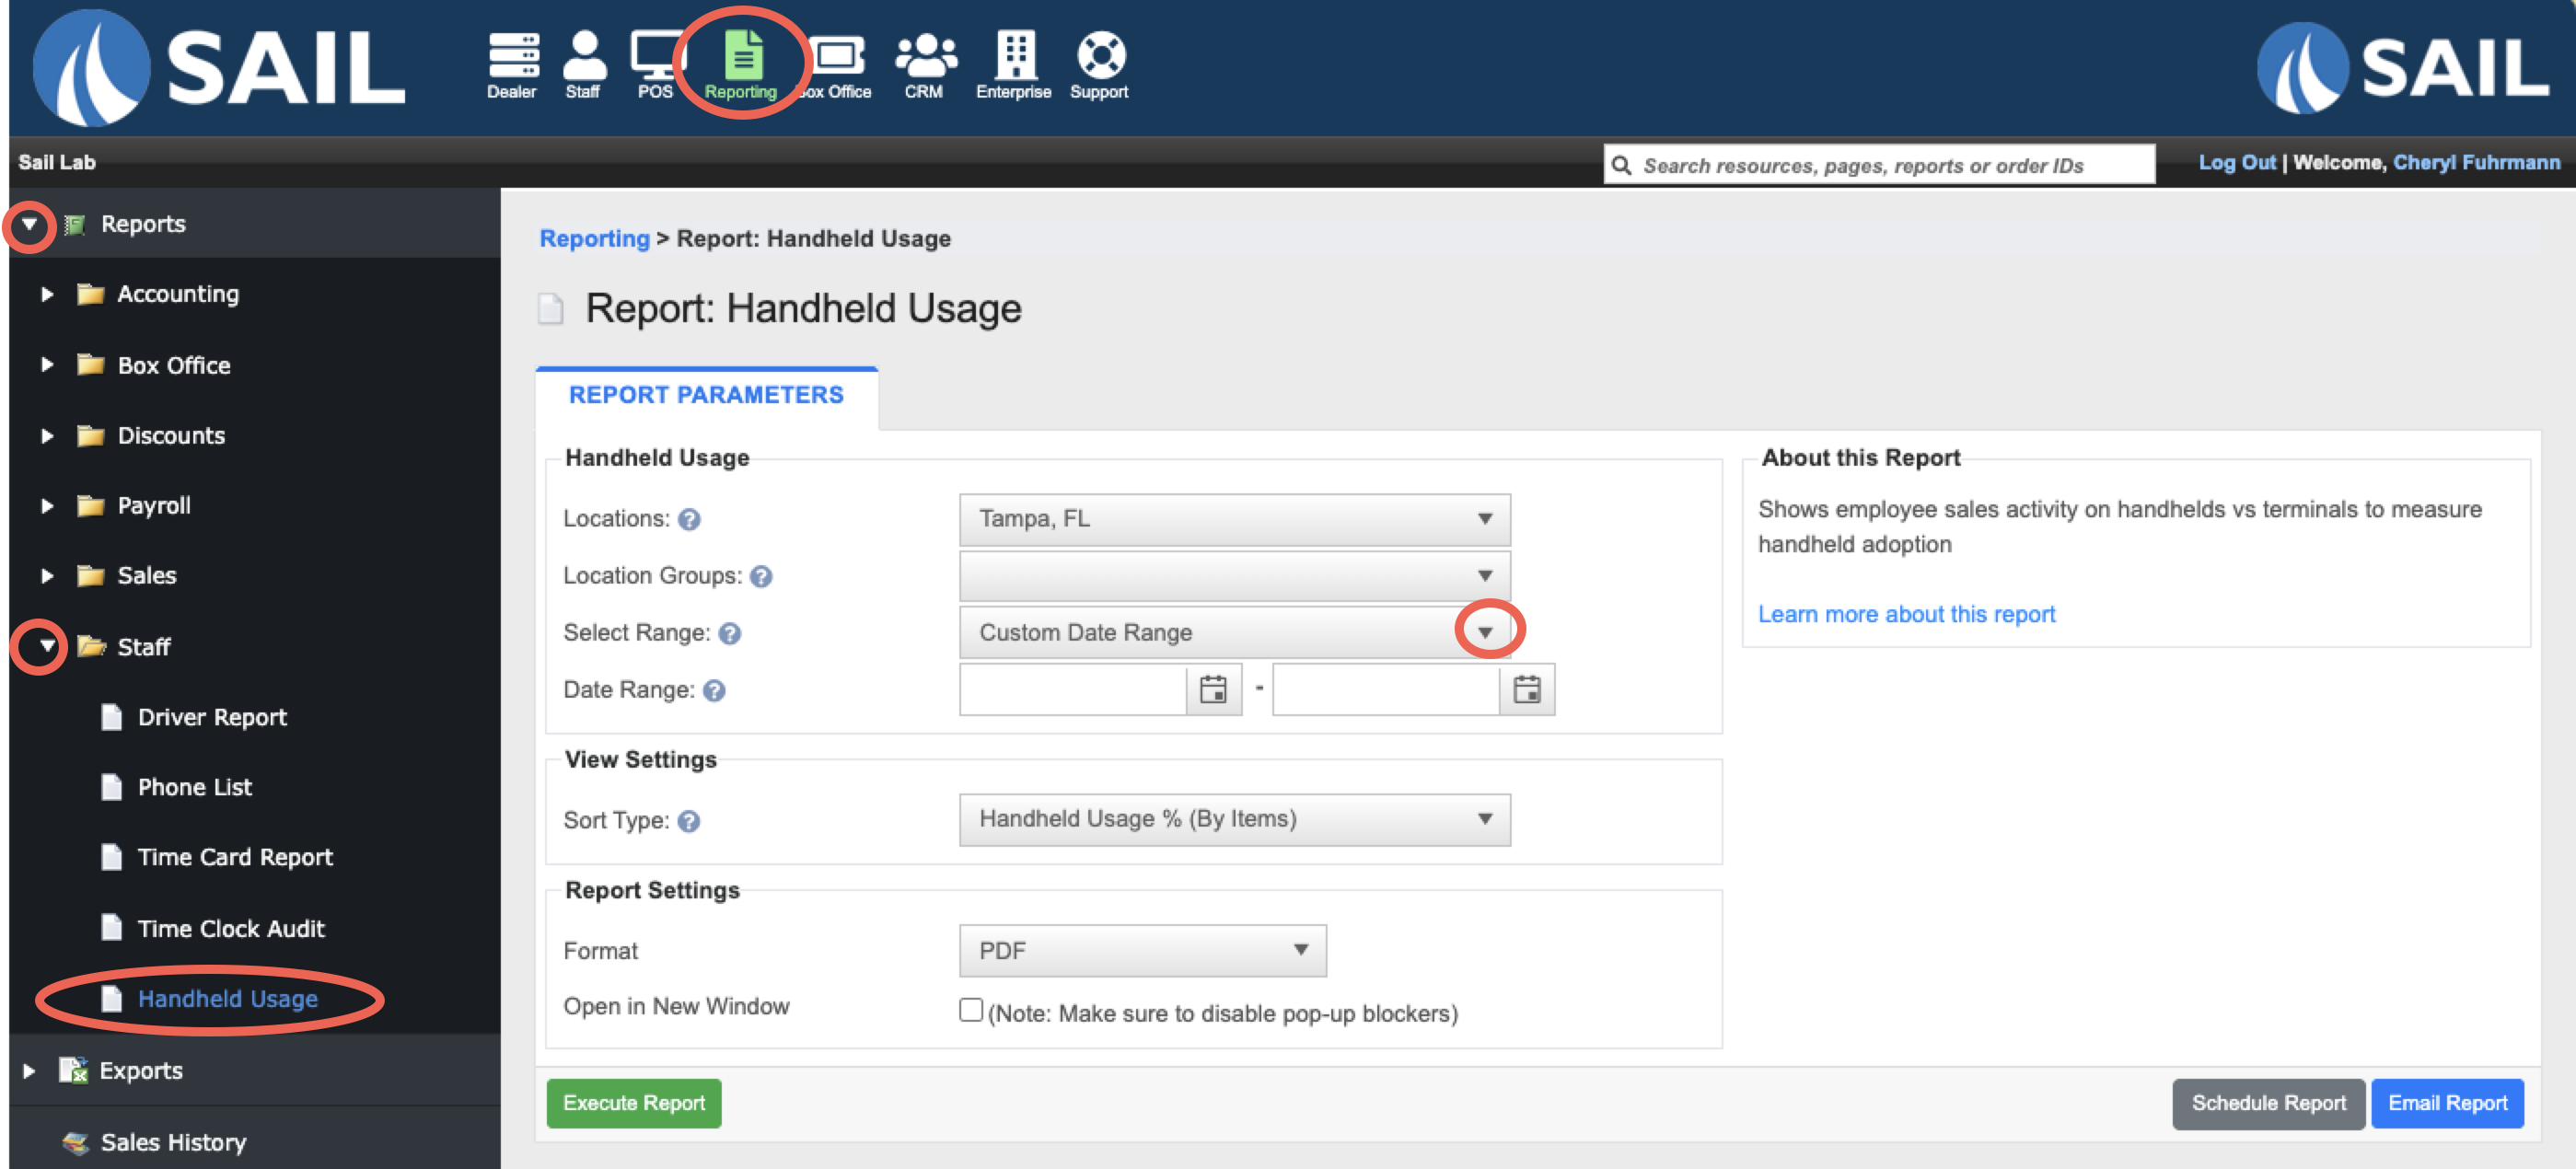
Report Options
Filters
-
Location Group – Allows you to run the report for a pre-configured group.
View Settings
-
Sort Type – Sorts by Handheld Usage % (By Items), Handheld Usage % (By Sales), or Employee name.
What it looks like
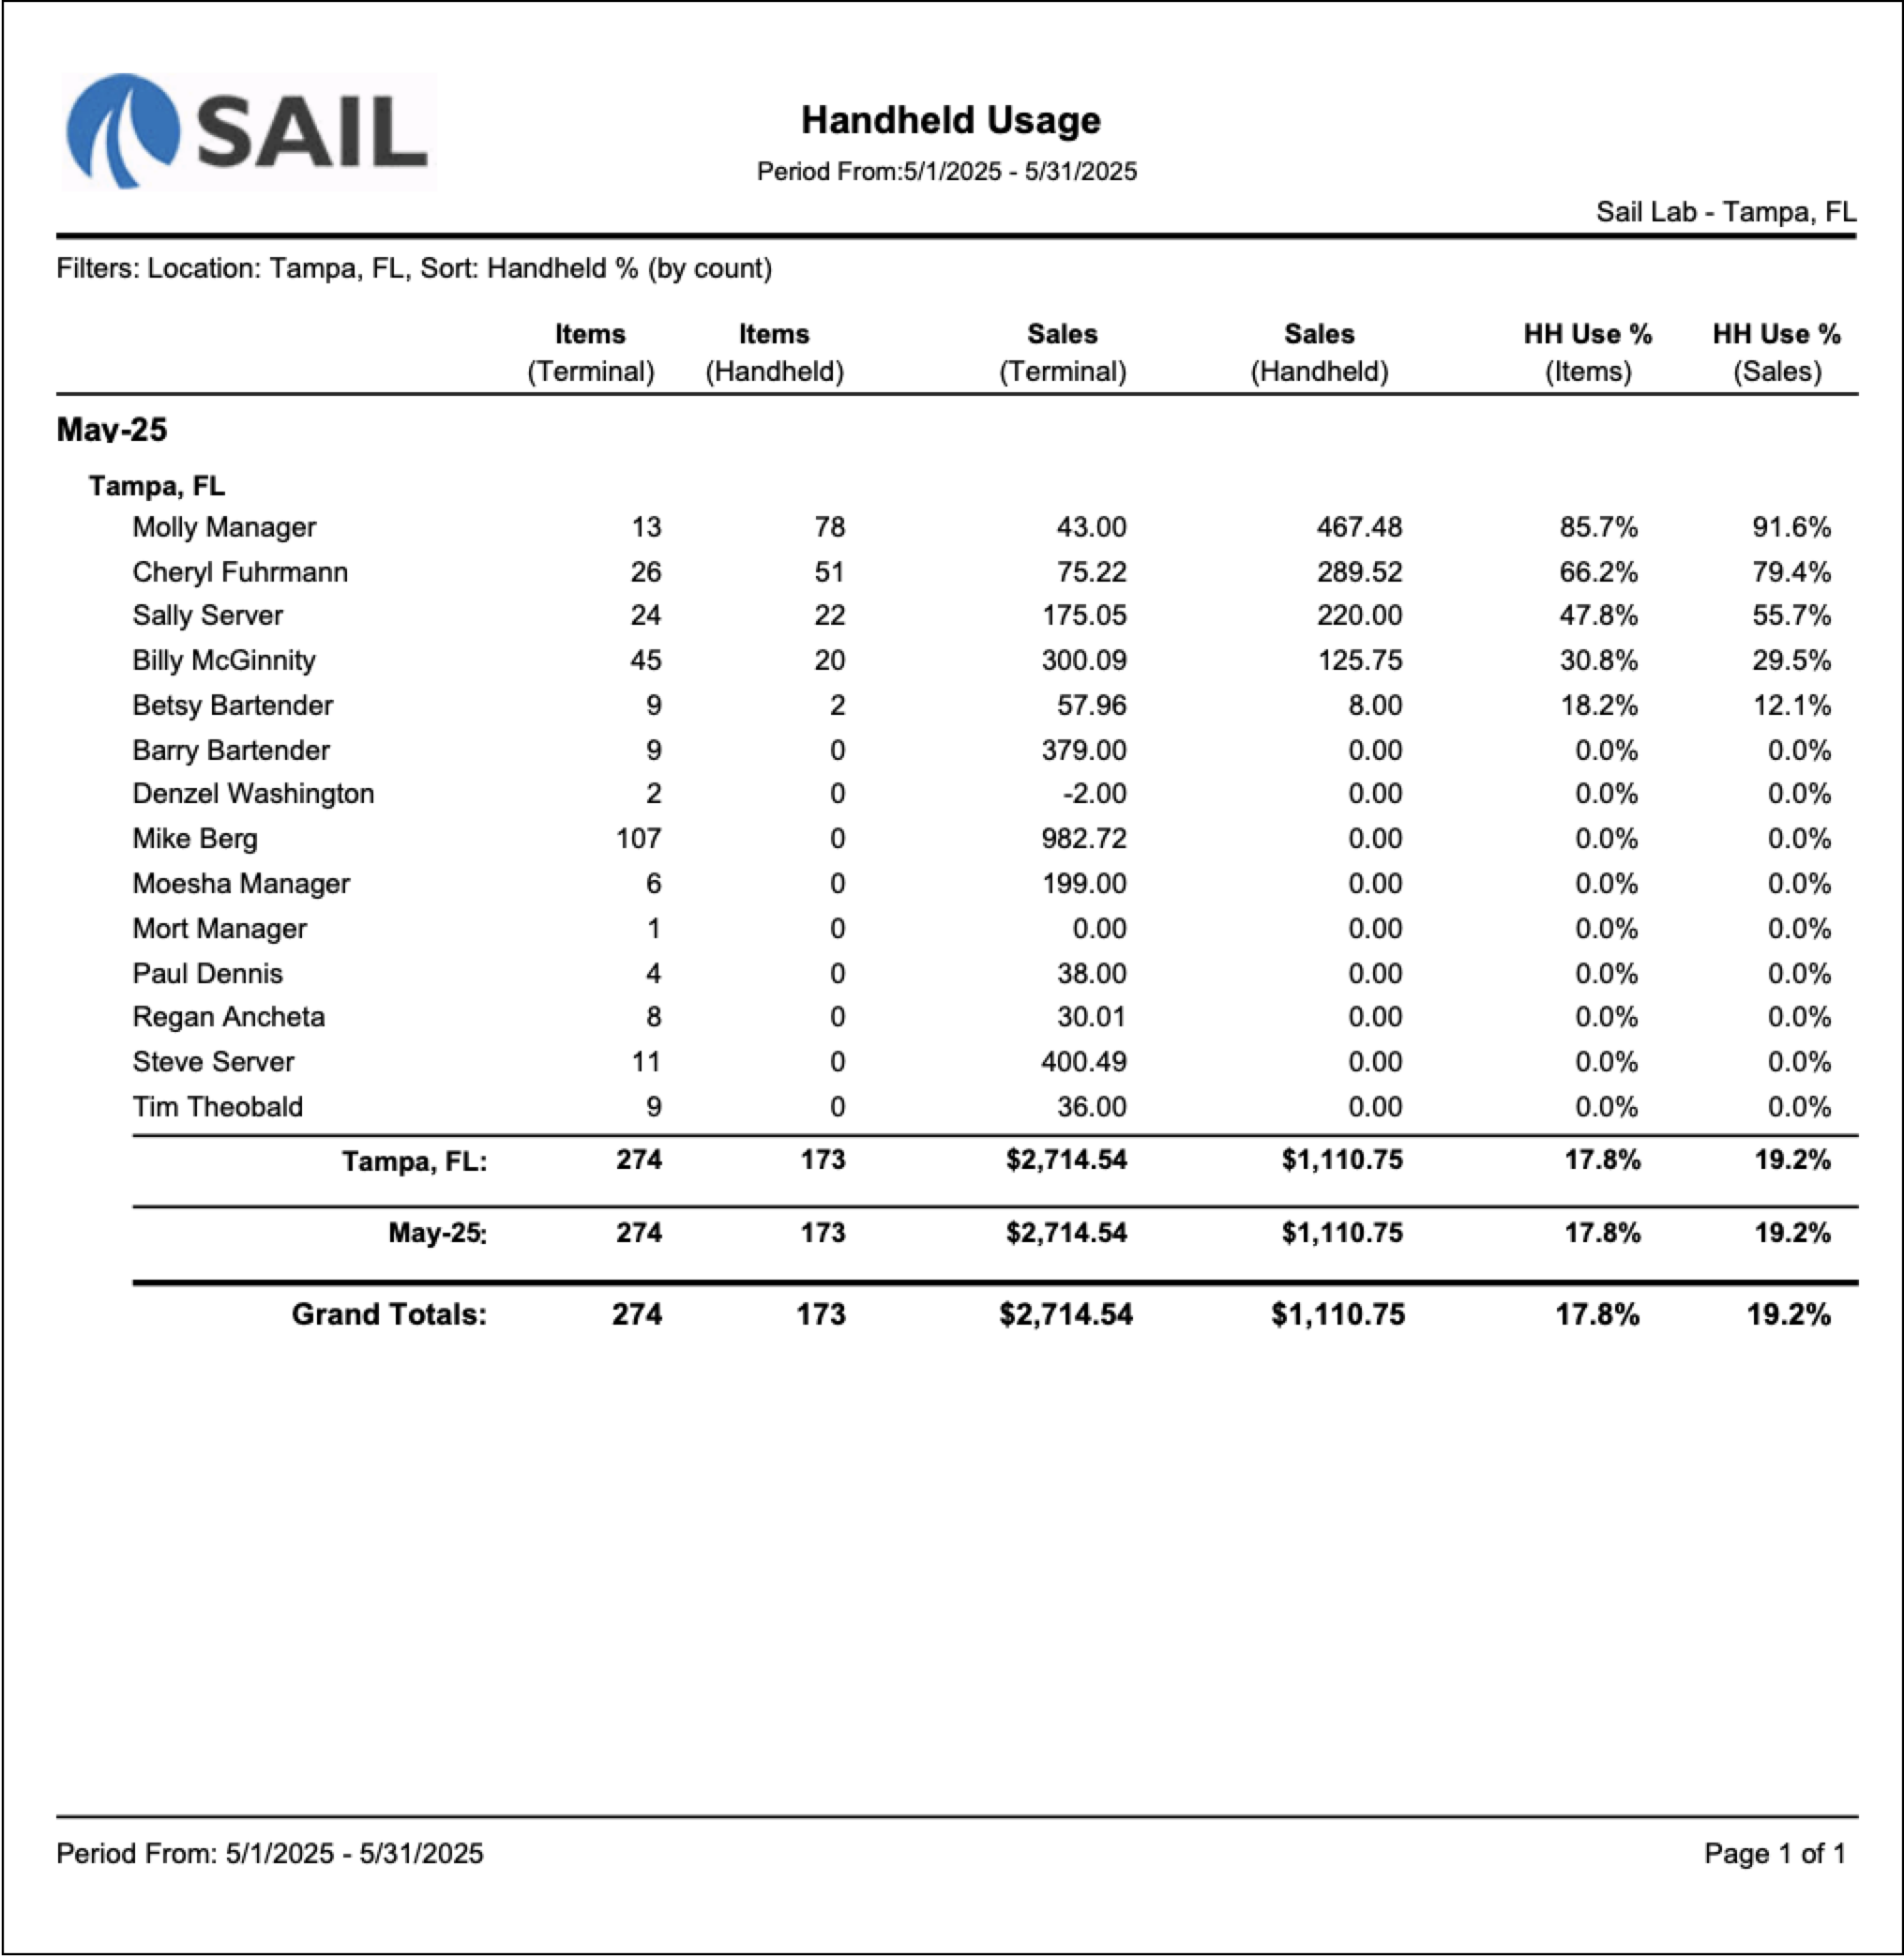
Report Parts
The report is organized by:
- Month
- Location
- Employee - Each employee is listed with their handheld and terminal activity for the selected date range.
Columns include:
-
Items (Terminal) – The number of items the employee entered on a POS terminal.
-
Items (Handheld) – The number of items the employee entered on a handheld device.
-
Sales (Terminal) $ – The net sales amount entered on a POS terminal..
-
Sales (Handheld) $ – The net sales amount entered on a handheld device.
- HH Use % (Items) - The percentage of items entered on a handheld device.
- Formula: Handheld Items ÷ (Handheld Items + Terminal Items)
- HH Use % (Sales) - The percentage of sales dollars entered on a handheld device.
- Formula: Handheld Sales ÷ (Handheld Sales + Terminal Sales)
At the bottom, the totals row shows:
-
Location Totals – Displays combined handheld and terminal activity for all employees at the location.
-
Monthly Totals – Displays totals for the reporting month.
-
Grand Total $ – Displays totals for the entire report.
How to Use This Report
- See which employees are actively using handheld devices and which employees are still relying on POS terminals.
- Track handheld adoption after rolling out new handheld devices.
- Identify employees who may need additional handheld training.
- Compare handheld usage across different locations.
- Measure handheld adoption based on either item counts or sales dollars.
- Use the location totals to determine overall handheld usage percentages for the store.
- Sort by Handheld Usage % (By Items) when you want to focus on transaction volume.
- Sort by Handheld Usage % (By Sales) when you want to focus on sales dollars processed through handhelds.