
Driver Report
The Driver Report tracks delivery activity for your drivers, including trip counts, delivery times, average trip duration, and total time spent on deliveries. It can be used to monitor individual driver performance, review delivery efficiency, and measure overall fleet performance.
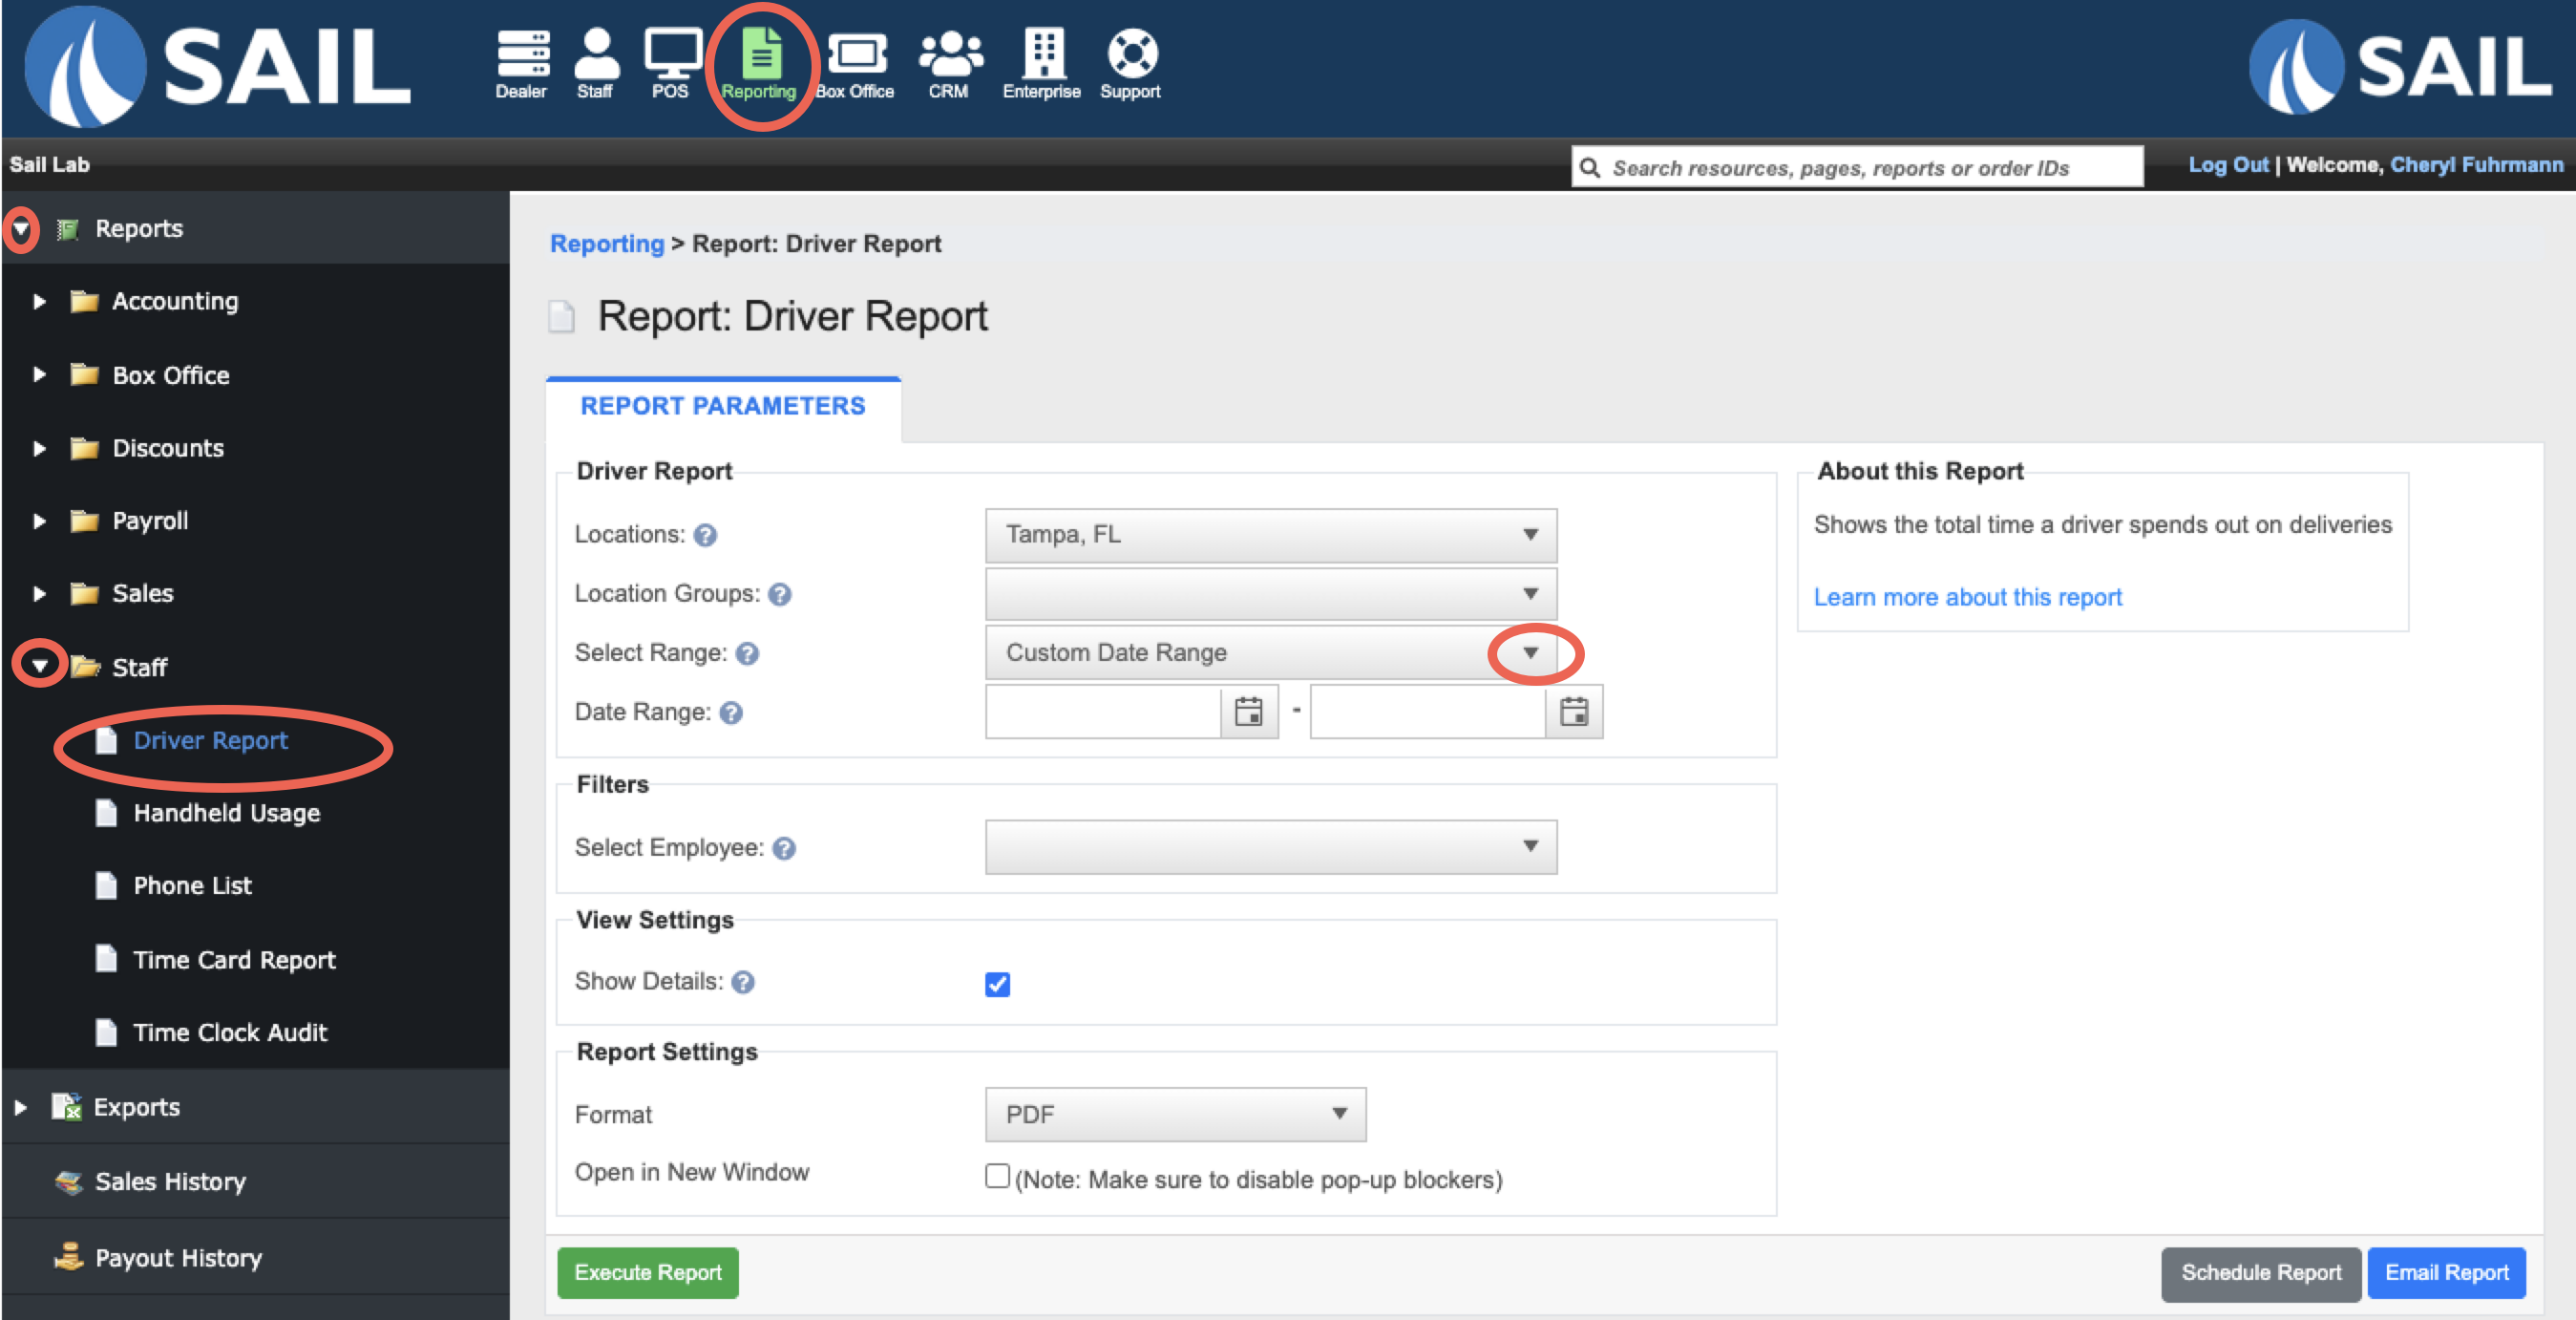
Where to find the report
- Backoffice --> Reporting --> Reports --> Staff folder --> Driver Report --> Select Date Range --> Execute
Report Options
Filters
-
Location Group – Allows you to run the report for a pre-configured group.
- Select Employee - Allows you to select individual or selected employees
View Settings
- Show Details - When enabled, each driver receives their own section showing the details of each trip
What it looks like
Report Parts
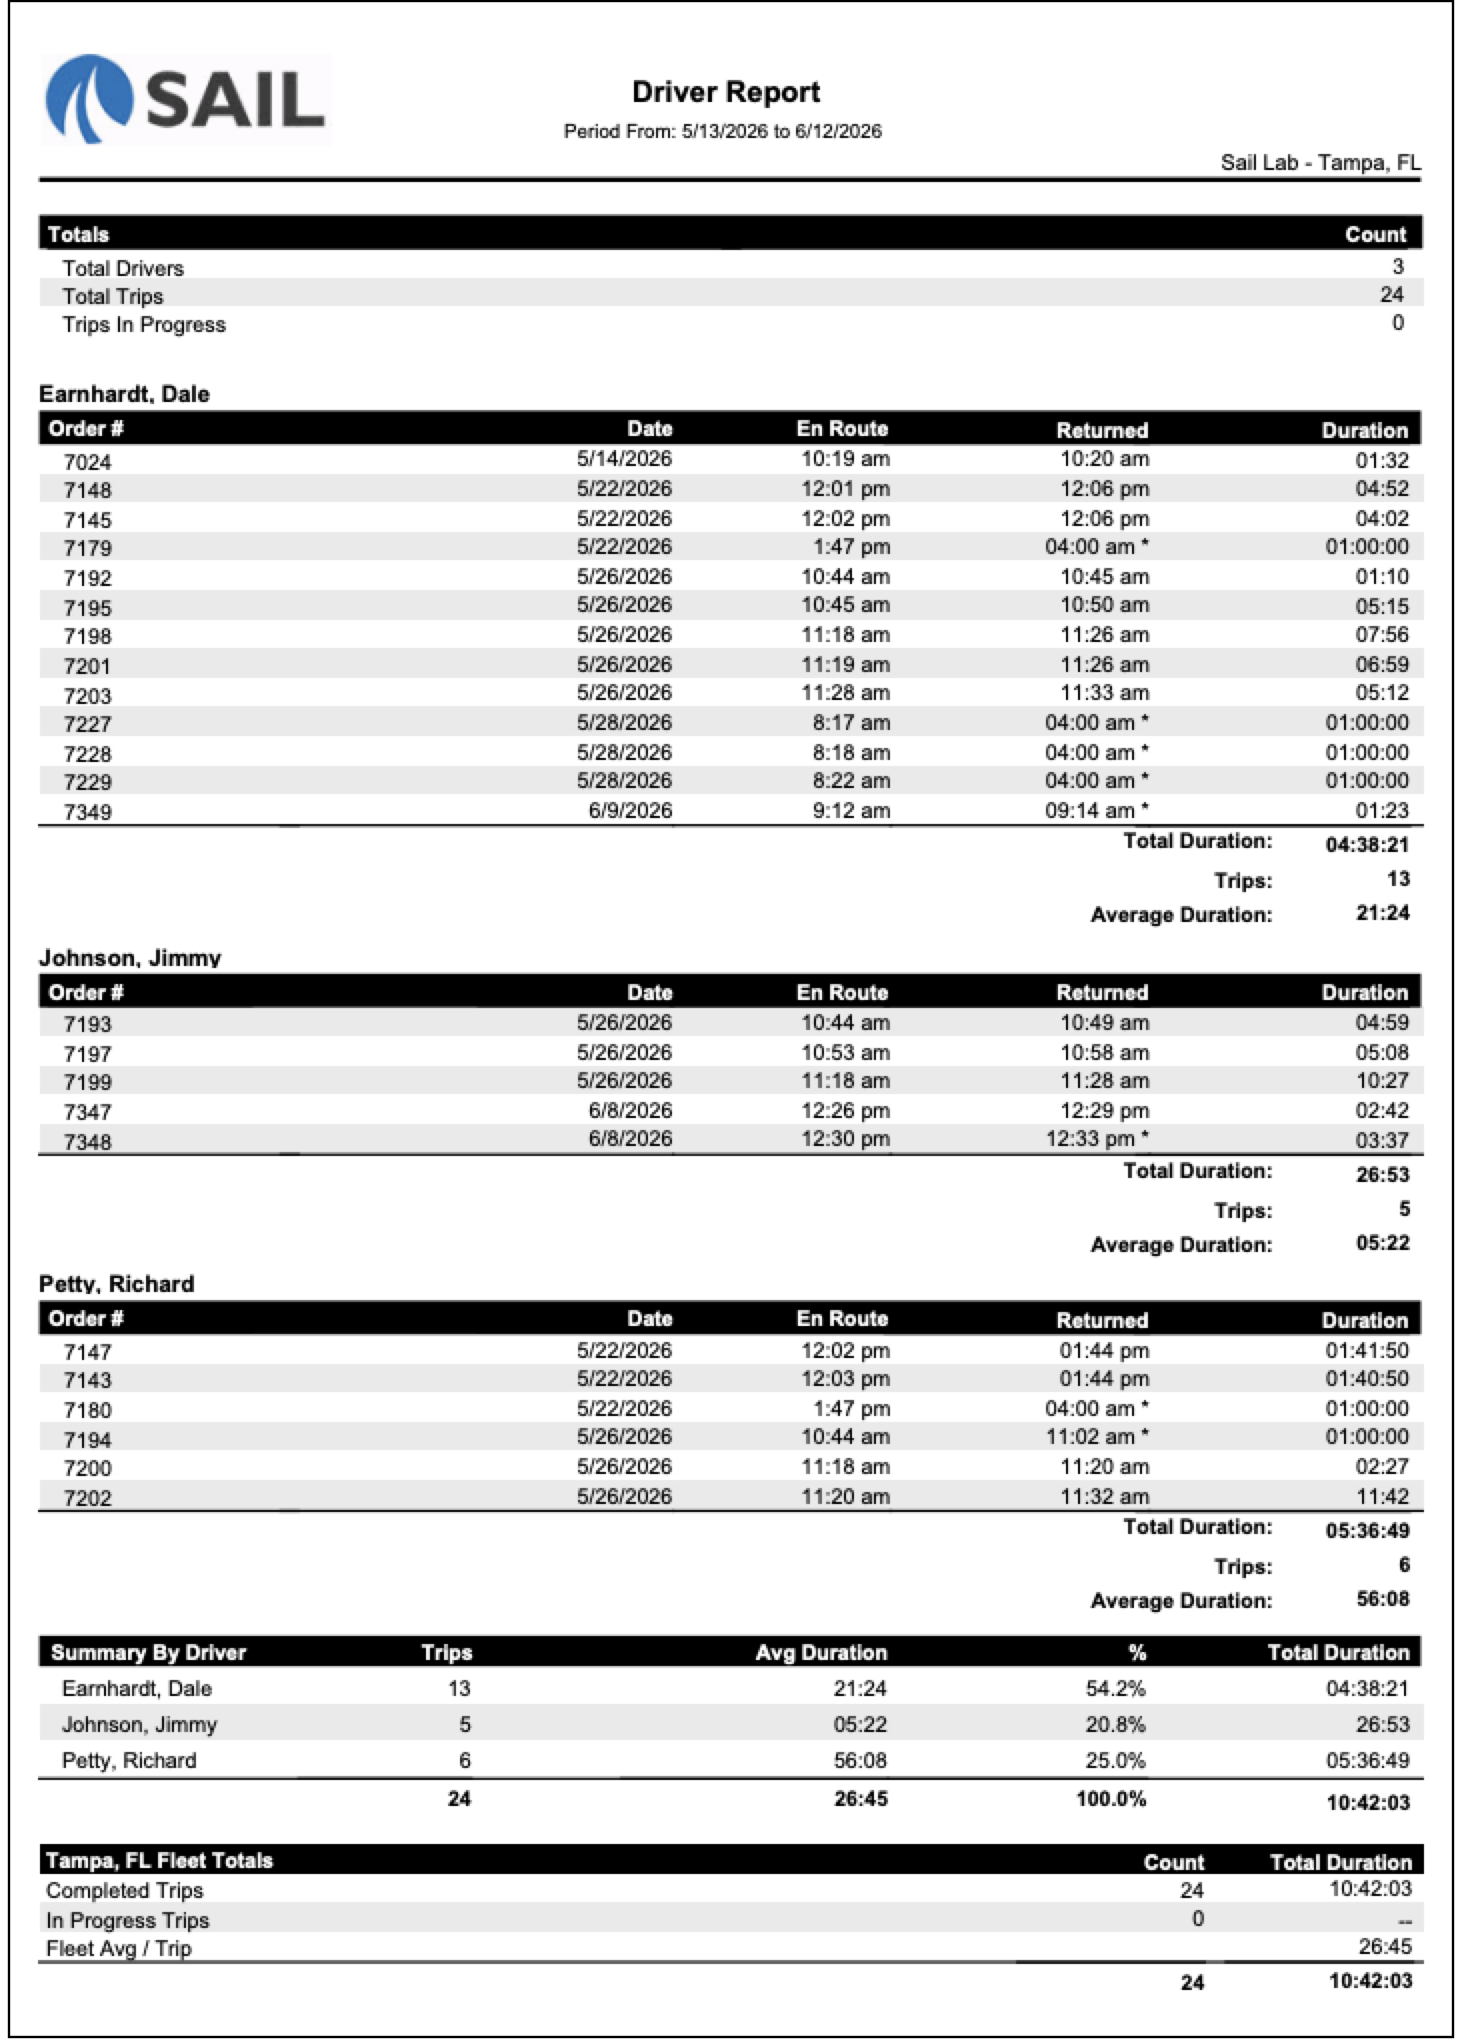
The report has four sections:
- Totals
- Driver Detail (one section per driver — only visible when Show Details is checked)
- Trips are listed in date/time order for each driver
- Summary By Driver
- Fleet Totals
Drivers with no trips in the selected date range will not appear on the report.
Totals Section Columns —
- Total Drivers – Number of drivers with at least one trip in the selected date range.
- Total Trips – Total number of delivery trips across all drivers.
- Trips In Progress – Trips currently marked as out on delivery (driver not yet returned).
Driver Detail Columns —
- Order # – The POS order number associated with the delivery.
- Date – The date the trip took place.
- En Route – The time the order was assigned to the driver
- Returned – The time the driver marked the order as completed
- An asterisk (*) next to the time means the driver was never manually returned on the POS. The system automatically set the return time to the server close time for that day.
- Duration – How long the trip took, displayed in MM:SS format.
A subtotal block appears below each driver's trip list and displays:
- Total Duration – Sum of all trip durations for that driver (HH:MM:SS).
- Trips – Number of trips for that driver in the date range.
- Average Duration – Total Duration ÷ number of trips (MM:SS).
Summary By Driver Columns —
- Driver – Driver name.
- Trips – Number of trips taken in the date range.
- Avg Duration – Average time per trip: Total Duration ÷ number of trips (MM:SS).
- % – That driver's share of the total trip count for the period (e.g., 13 of 24 trips = 54.2%).
- Total Duration – Cumulative time that driver was out on delivery (HH:MM:SS).
A grand total row at the bottom of this section shows the combined trip count, fleet average duration, 100%, and total fleet duration.
Fleet Totals Columns —
- Completed Trips – Total trips returned, with the combined duration for all of them.
- In Progress Trips – Trips still out at the time the report is run. Duration shows "--" if the count is zero.
- Fleet Avg / Trip – Average trip duration across all drivers and trips for the location.
How to Use This Report
- Run it after each shift or at the end of the week to review how long drivers are spending out on deliveries.
- Look for asterisked return times — those trips were never closed on the POS and may need follow-up with the driver.
- Compare Average Duration across drivers to spot outliers or recognize top performers.
- Use the % column in the Summary By Driver section to see how delivery workload is distributed across your team.
- Filter by a single employee to pull one driver's history for a specific date range.
- Use Fleet Avg / Trip as a baseline when planning staffing for busy delivery periods.
- Toggle Show Details off when you just need a quick summary without the trip-by-trip breakdown.
- Use the Schedule Report or Email Report options to automate delivery of this report to managers on a regular cadence.
No Comments