
Labor Productivity Report
The Labor Productivity Report shows how effectively labor hours are being used compared to sales and guest counts. It provides key efficiency metrics, helping managers understand the balance between labor costs, guest volume, and revenue.
- This report shows labor productivity by comparing guest count, labor hours, labor cost, and sales to help evaluate staffing efficiency and overall performance.
- The report can be run for any date range and groups matching weekdays together, making it easier to identify labor trends and compare performance across days of the week.
- A Total column combines all data from the selected date range to provide an overall productivity summary.
Where to find the report
- Backoffice --> Reporting --> Reports --> Payroll folder --> Labor Productivity --> Select a Date Range --> Execute
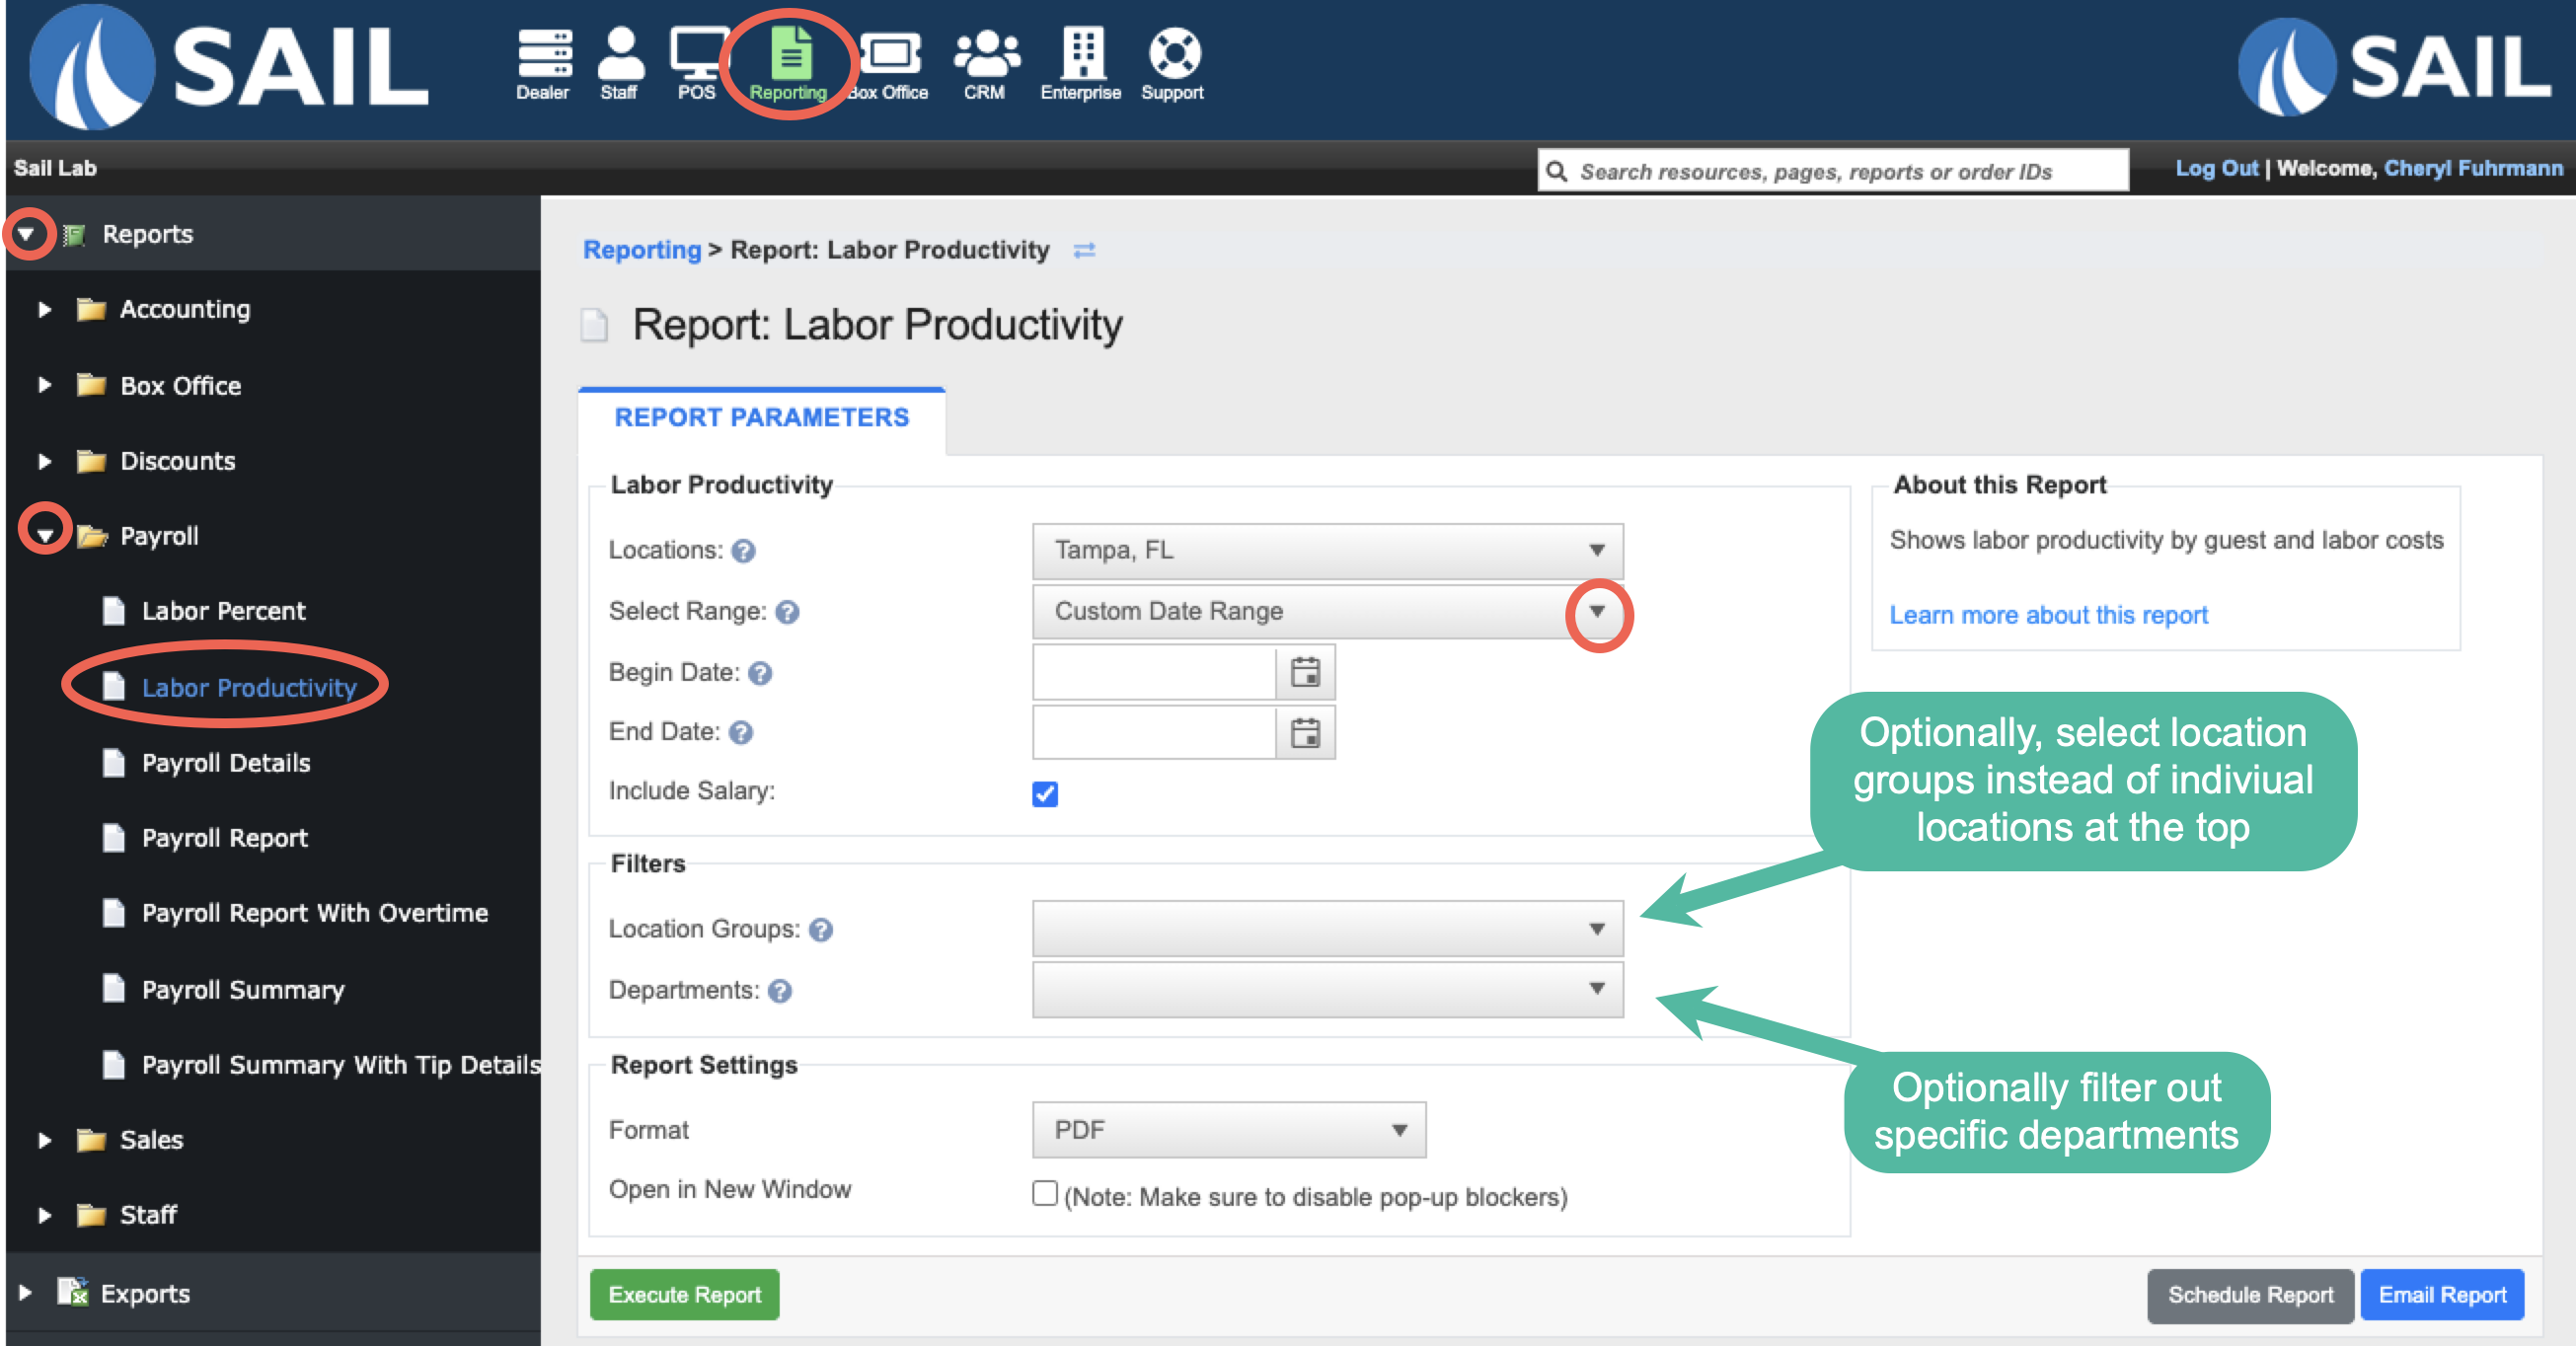
- If you are a multi store location you can run the report for a single location, select multiple locations from the dropdown, or use the Location Groups dropdown to choose a pre-configured group.
-
Select a beginning and ending date to define the reporting period. The report can be run for any date range and will automatically combine matching weekdays together for analysis if ran for more than 7 days.
Report Options
Filters
- Location Groups - Allows you to run the report for a pre-configured group.
-
Departments – Allows you to run the report for specific departments instead of all employees.
What it looks like
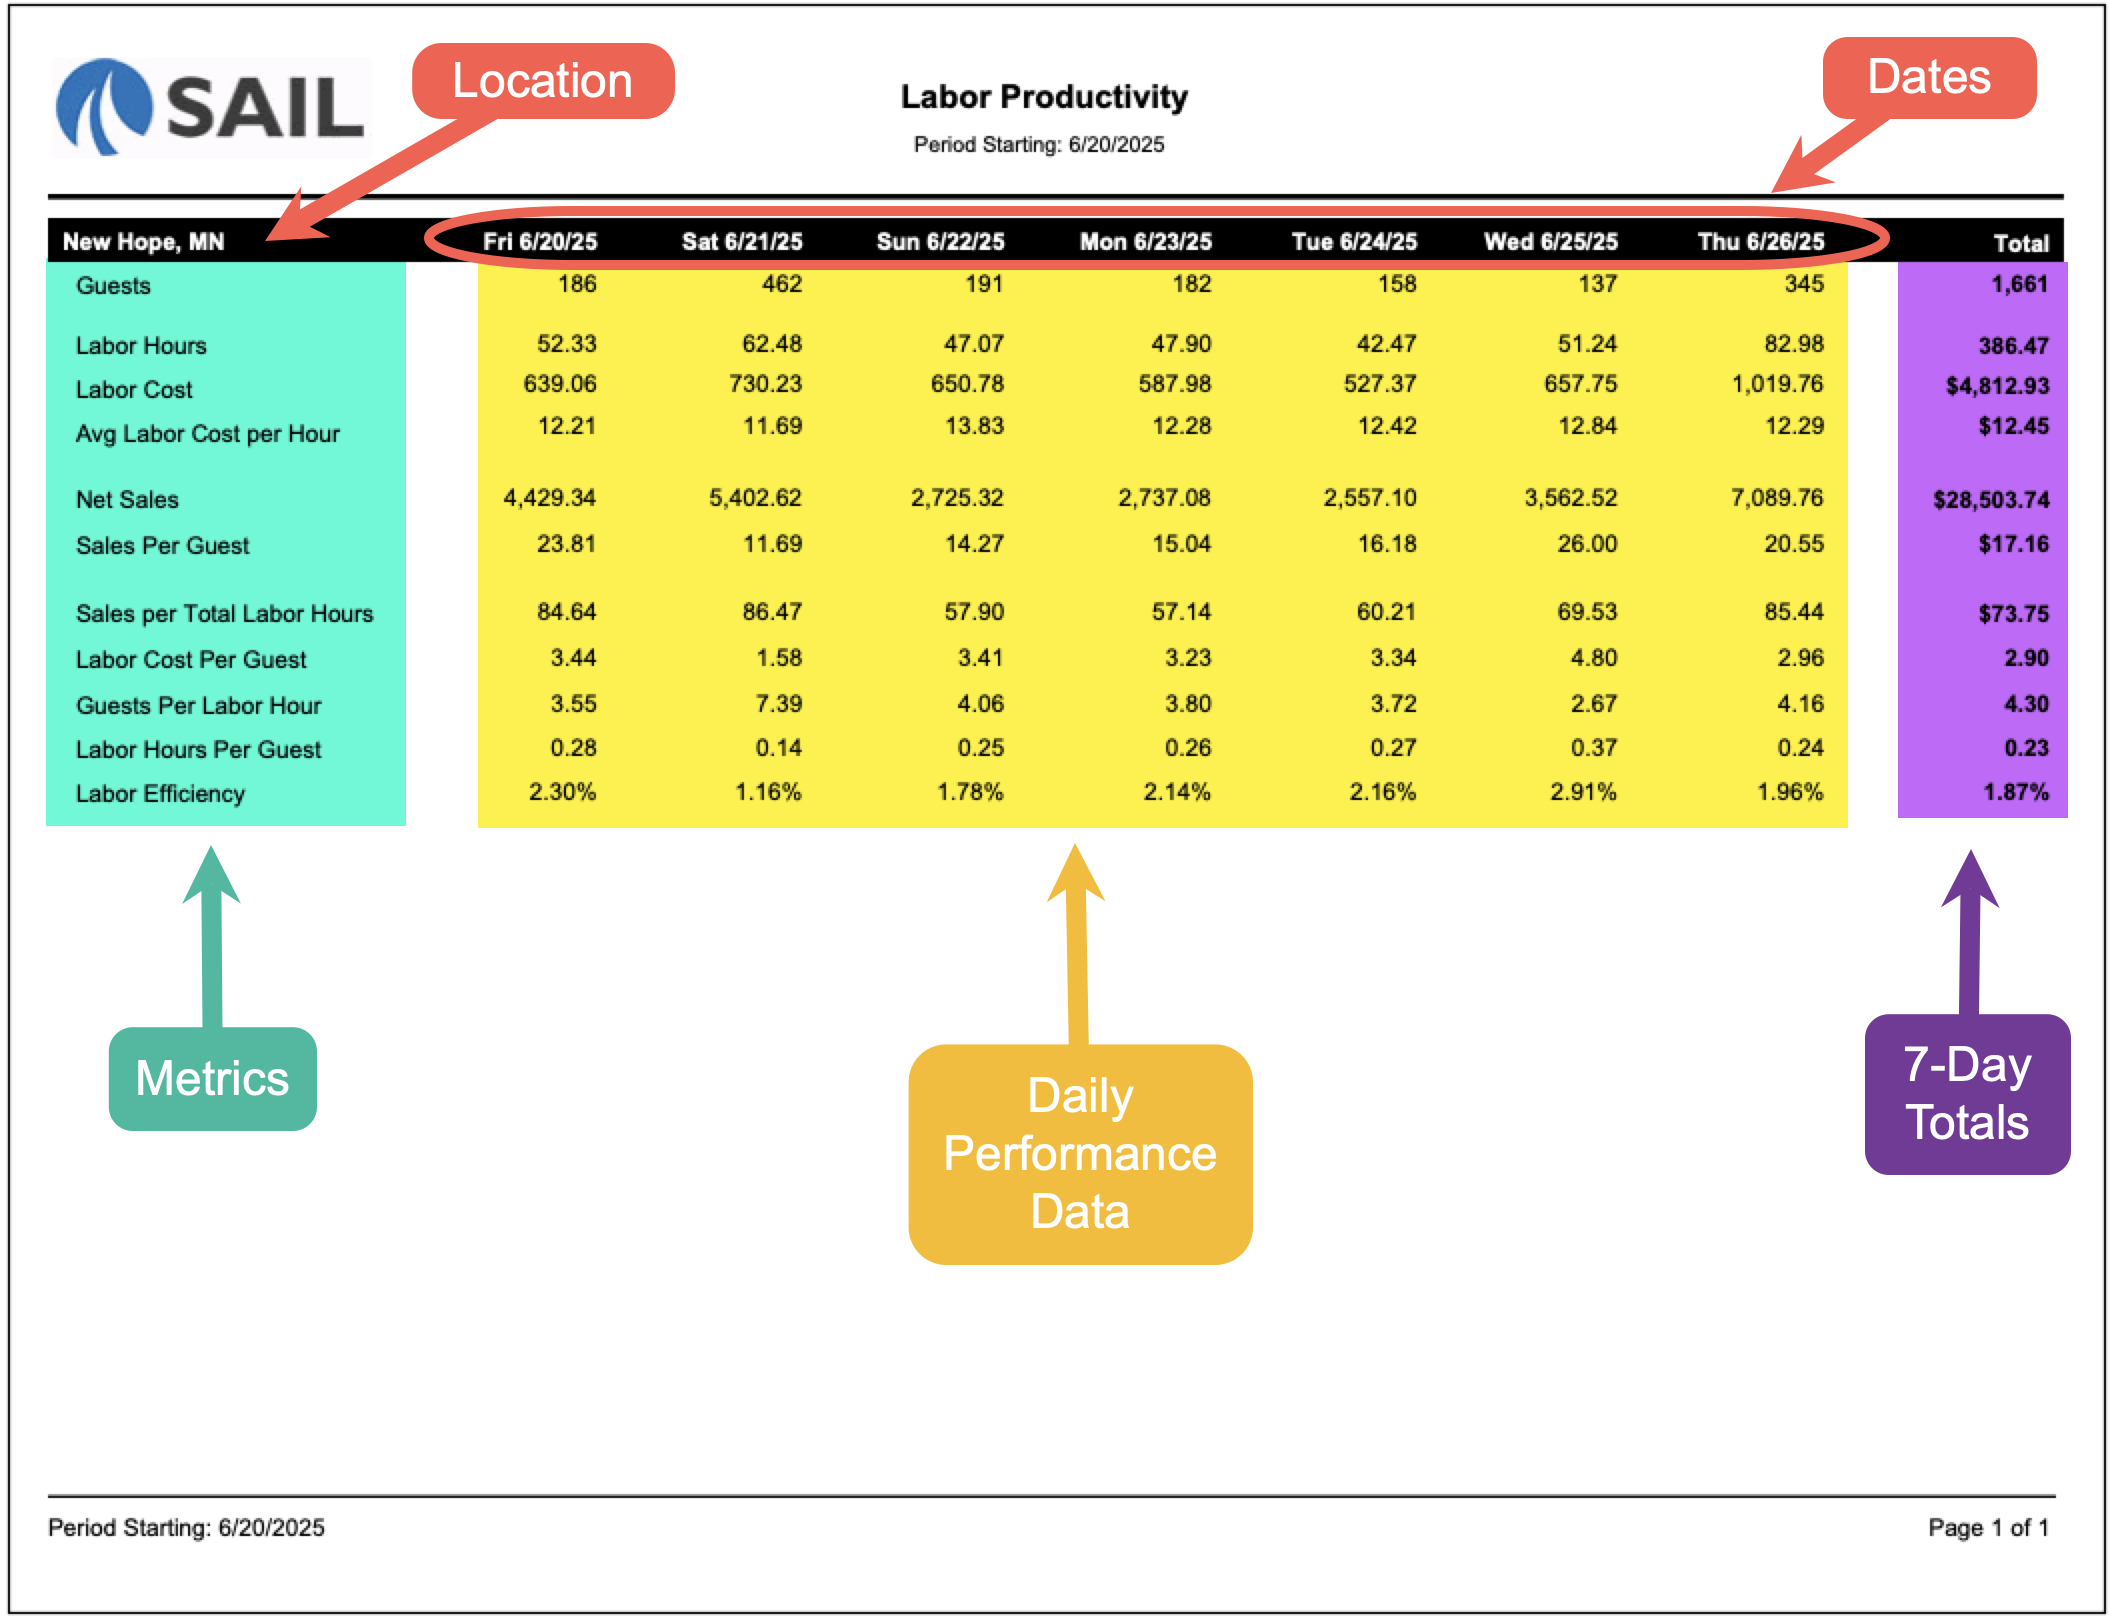
Report Parts
Report Structure
- If the selected date range is 7 days or less, each column will represent an individual day and display the day of the week and date (for example, Friday 6/20/25).
- If the selected date range is more than 7 days, matching weekdays will be combined into a single column.
- When weekdays are combined, the report will always begin with Monday and continue through Sunday.
- Each weekday column displays a number in parentheses showing how many of those days are included in the report.
- For example, Thursday (5) means data from five different Thursdays has been combined into a single column.
- This layout makes it easier to compare weekday performance and identify long-term labor and sales trends.
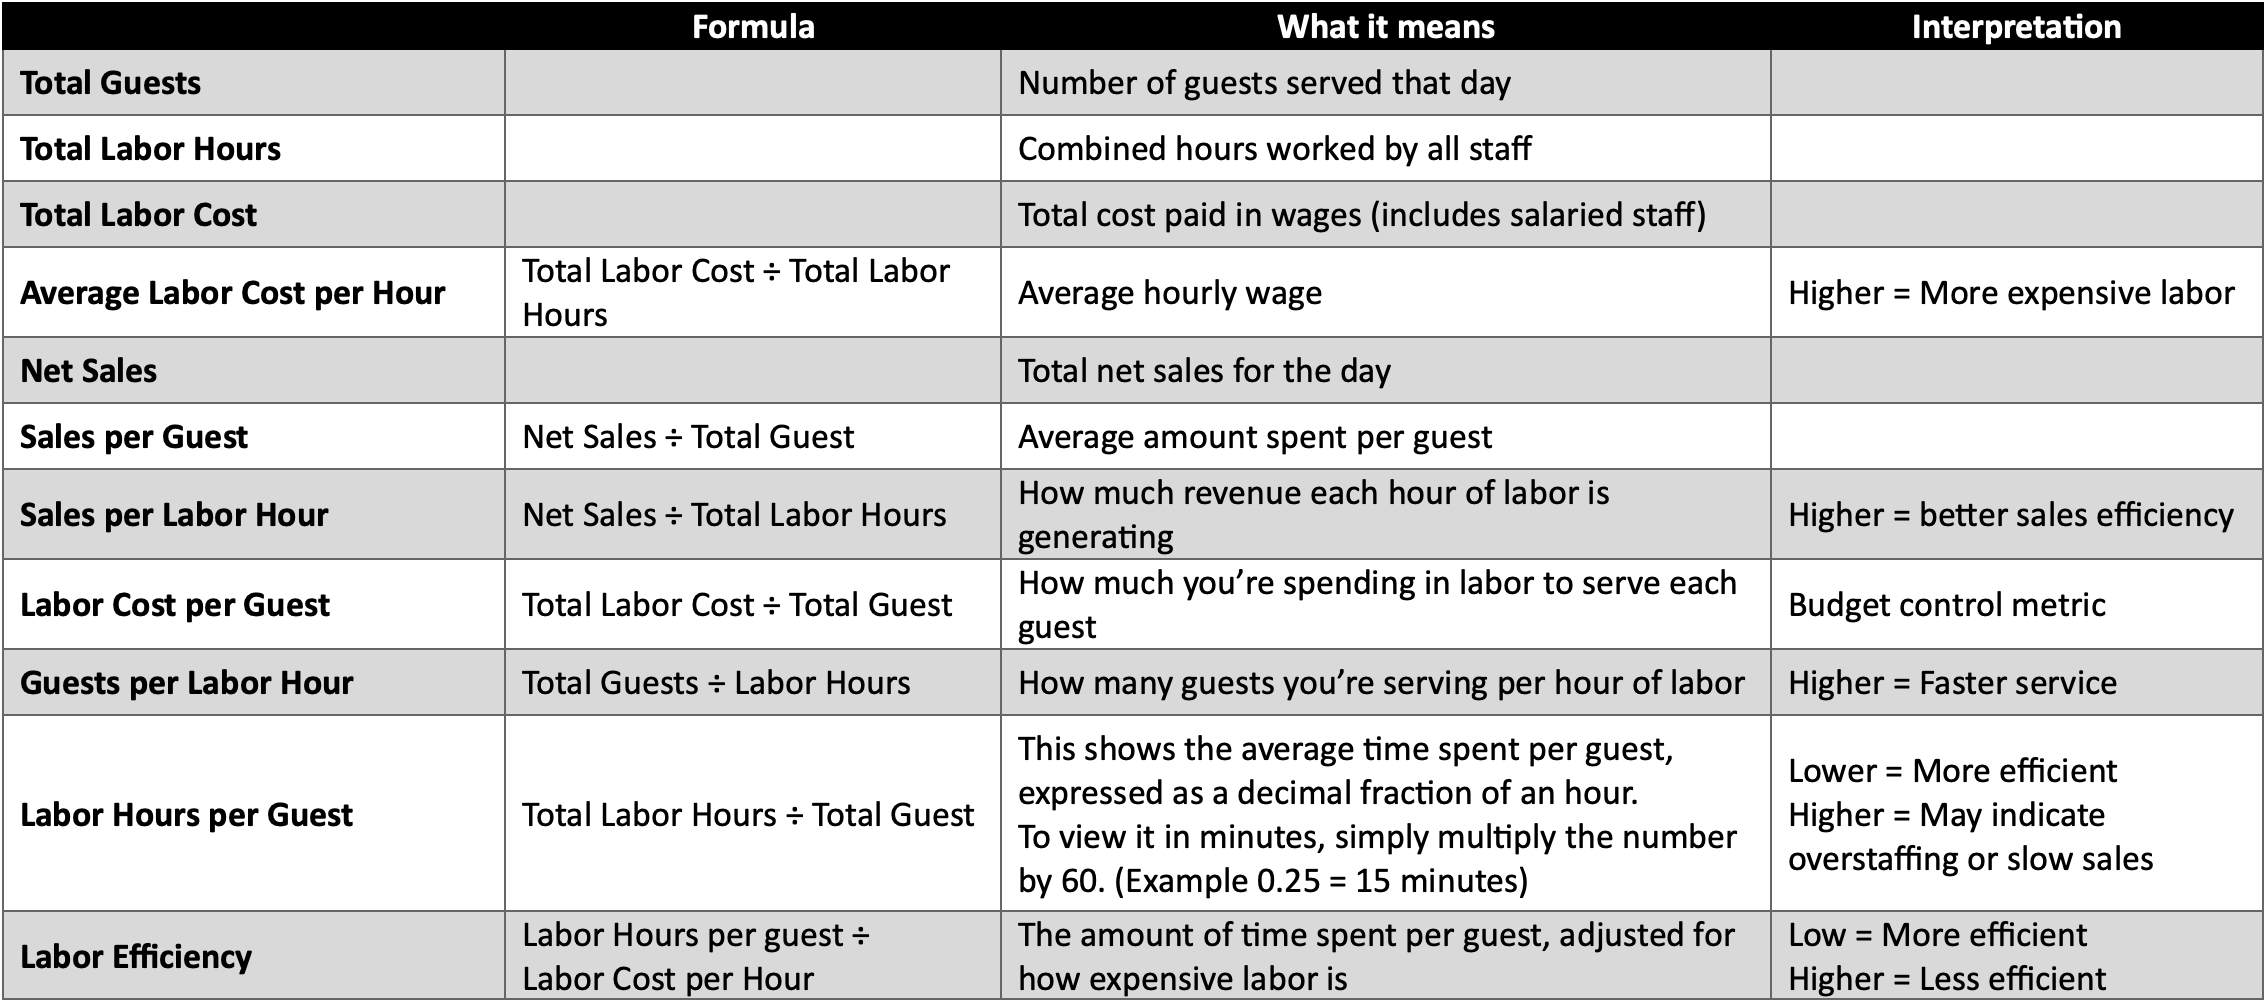
Report Columns and Formulas
For each day (and a total at the far right), the following data is shown:
-
Guests – Total number of guests served.
-
Labor Hours – Total hours worked by staff that day.
-
Labor Cost – Total dollar amount spent on wages for that day.
-
Avg Labor Cost per Hour – Shows the average wage cost per hour worked.
Formula: Labor Cost ÷ Labor Hours -
Net Sales – Total sales for the day (after discounts, comps, and voids).
-
Sales per Guest – Average sales per customer served.
Formula: Net Sales ÷ Guests -
Sales per Total Labor Hours – How much sales revenue is generated per labor hour. Higher is better.
Formula: Net Sales ÷ Labor Hours -
Labor Cost per Guest – The average labor expense per customer served.
Formula: Labor Cost ÷ Guests -
Guests per Labor Hour – How many guests are served per labor hour worked.
Formula: Guests ÷ Labor Hours -
Labor Hours per Guest – How many labor hours are used, on average, to serve each guest.
Formula: Labor Hours ÷ Guests -
Labor Efficiency – The amount of time spent per guest, adjusted for how expensive labor is
Formula: (Labor Hours per guest ÷ Labor Cost per Hour)
Totals Column
On the far-right, you'll see totals and averages across the entire selected date range:
-
Totals for Guests, Labor Hours, Labor Cost, and Net Sales.
-
Weighted averages for the per-hour and per-guest calculations.
-
Overall Labor Efficiency % for the entire period.
How to Use This Report
This report helps you:
-
Measure how effectively your labor is being used to generate sales.
-
Spot days where labor efficiency was high or low.
-
Track labor cost per guest to ensure profitability.
-
Compare guests per labor hour to see if staffing is aligned with guest traffic.
-
Use efficiency trends to improve scheduling and reduce wasted labor hours.
No Comments