
Item Sales Report by Employee
The Item Sales Report by Employee is most often used for contests or sales challenges (for example, tracking which employee sold the most desserts during a time period). It allows restaurants to compare sales performance by employee, by item, or by location.
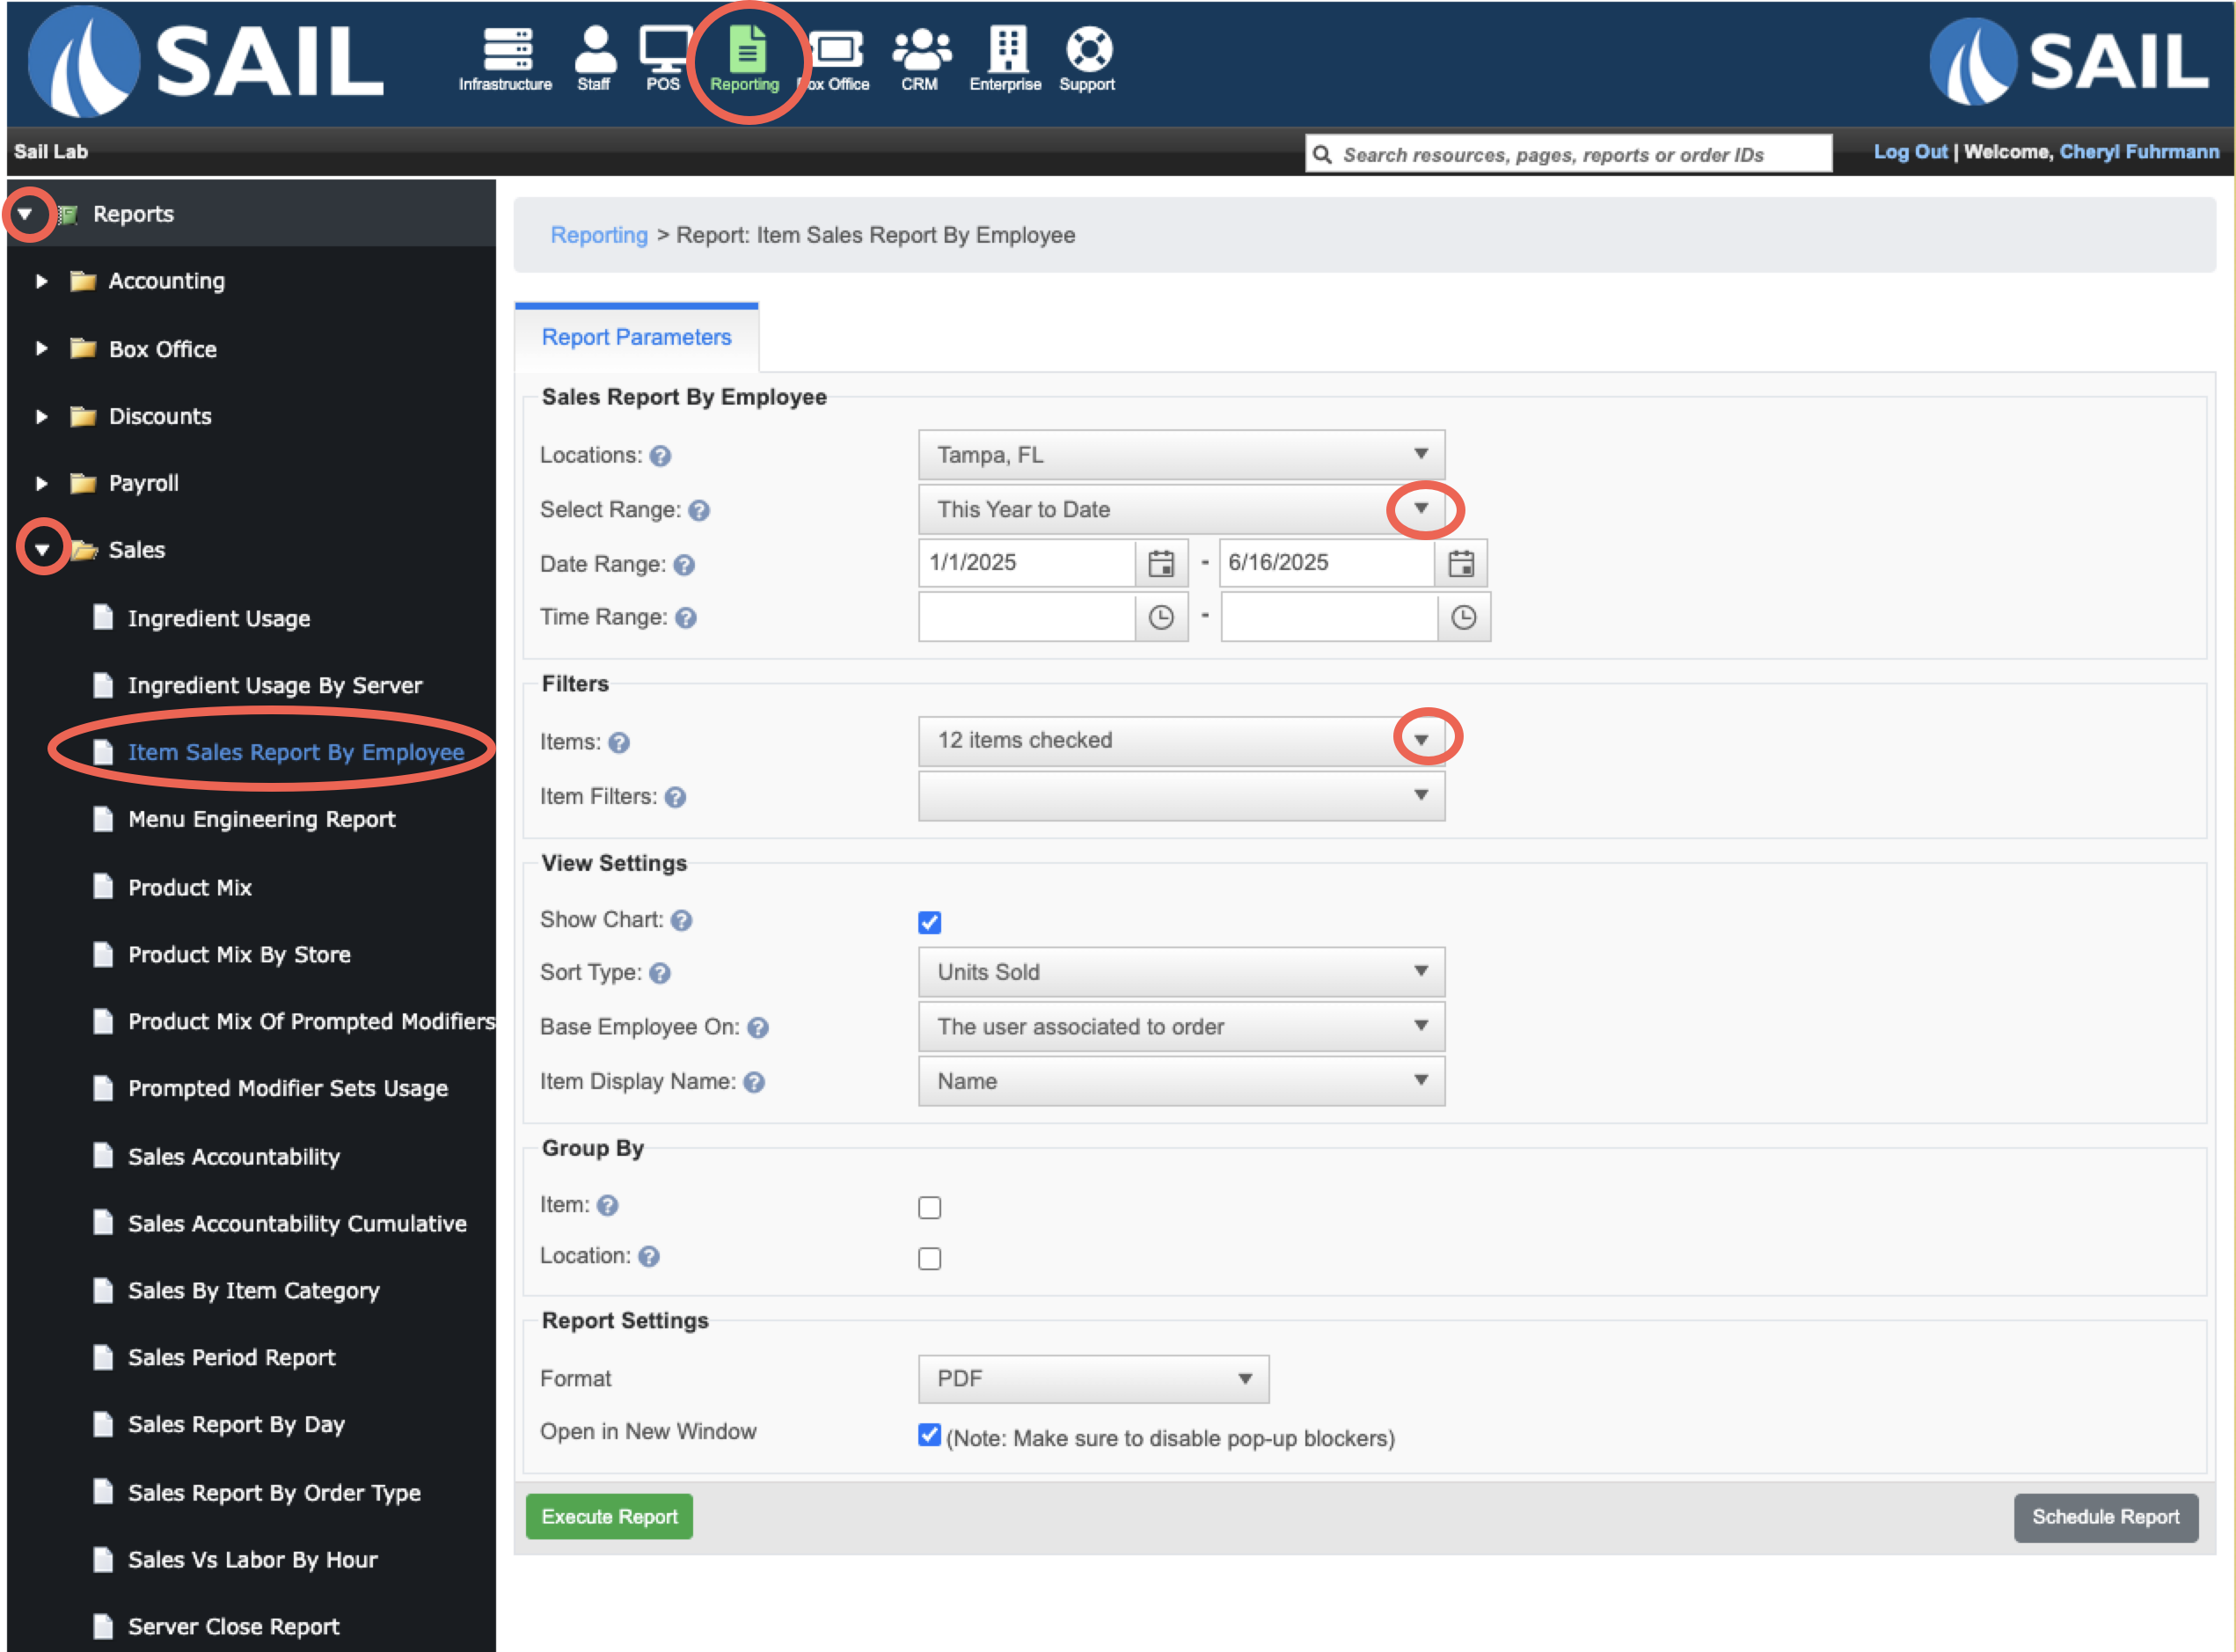
Where to find the report
- Backoffice --> Reporting --> Reports --> Sales folder --> Item Sales Report by Employee --> Select Date Range --> Select the Items you'd like included --> Execute
Report Options
Filters
-
Items – If nothing is selected, the report includes all items. You can also select specific items (e.g., all 12 desserts).
-
Item Filters – Use a pre-built filter (like “Desserts”) instead of selecting items one by one.
View Settings
-
Show Chart – Adds a bar graph at the top, showing employee totals visually.
-
Sort Type – Sorts by Units Sold (default), Net Sales, Total Sales, Comps, or Employee.
- Note: Sorting only applies within groups. Groups themselves are always alphabetical.
-
Base Employee On – Choose to count sales by either:
-
The user associated to the order OR
-
The user who rang in the item
-
-
Item Display Name – Choose which configured item name to display: Name, Kitchen Name, Receipt Name, or Online Name.
Group By
-
None selected – Groups results by employee (e.g., Sally sold the most desserts overall).
-
Item – Groups by each item, then lists employees under each item (e.g., who sold the most brownies, who sold the most cheesecake).
-
Location – Groups by store location, then lists employees under each store.
-
Item + Location – Groups first by location, then by item, then lists employees under each item.
What it looks like
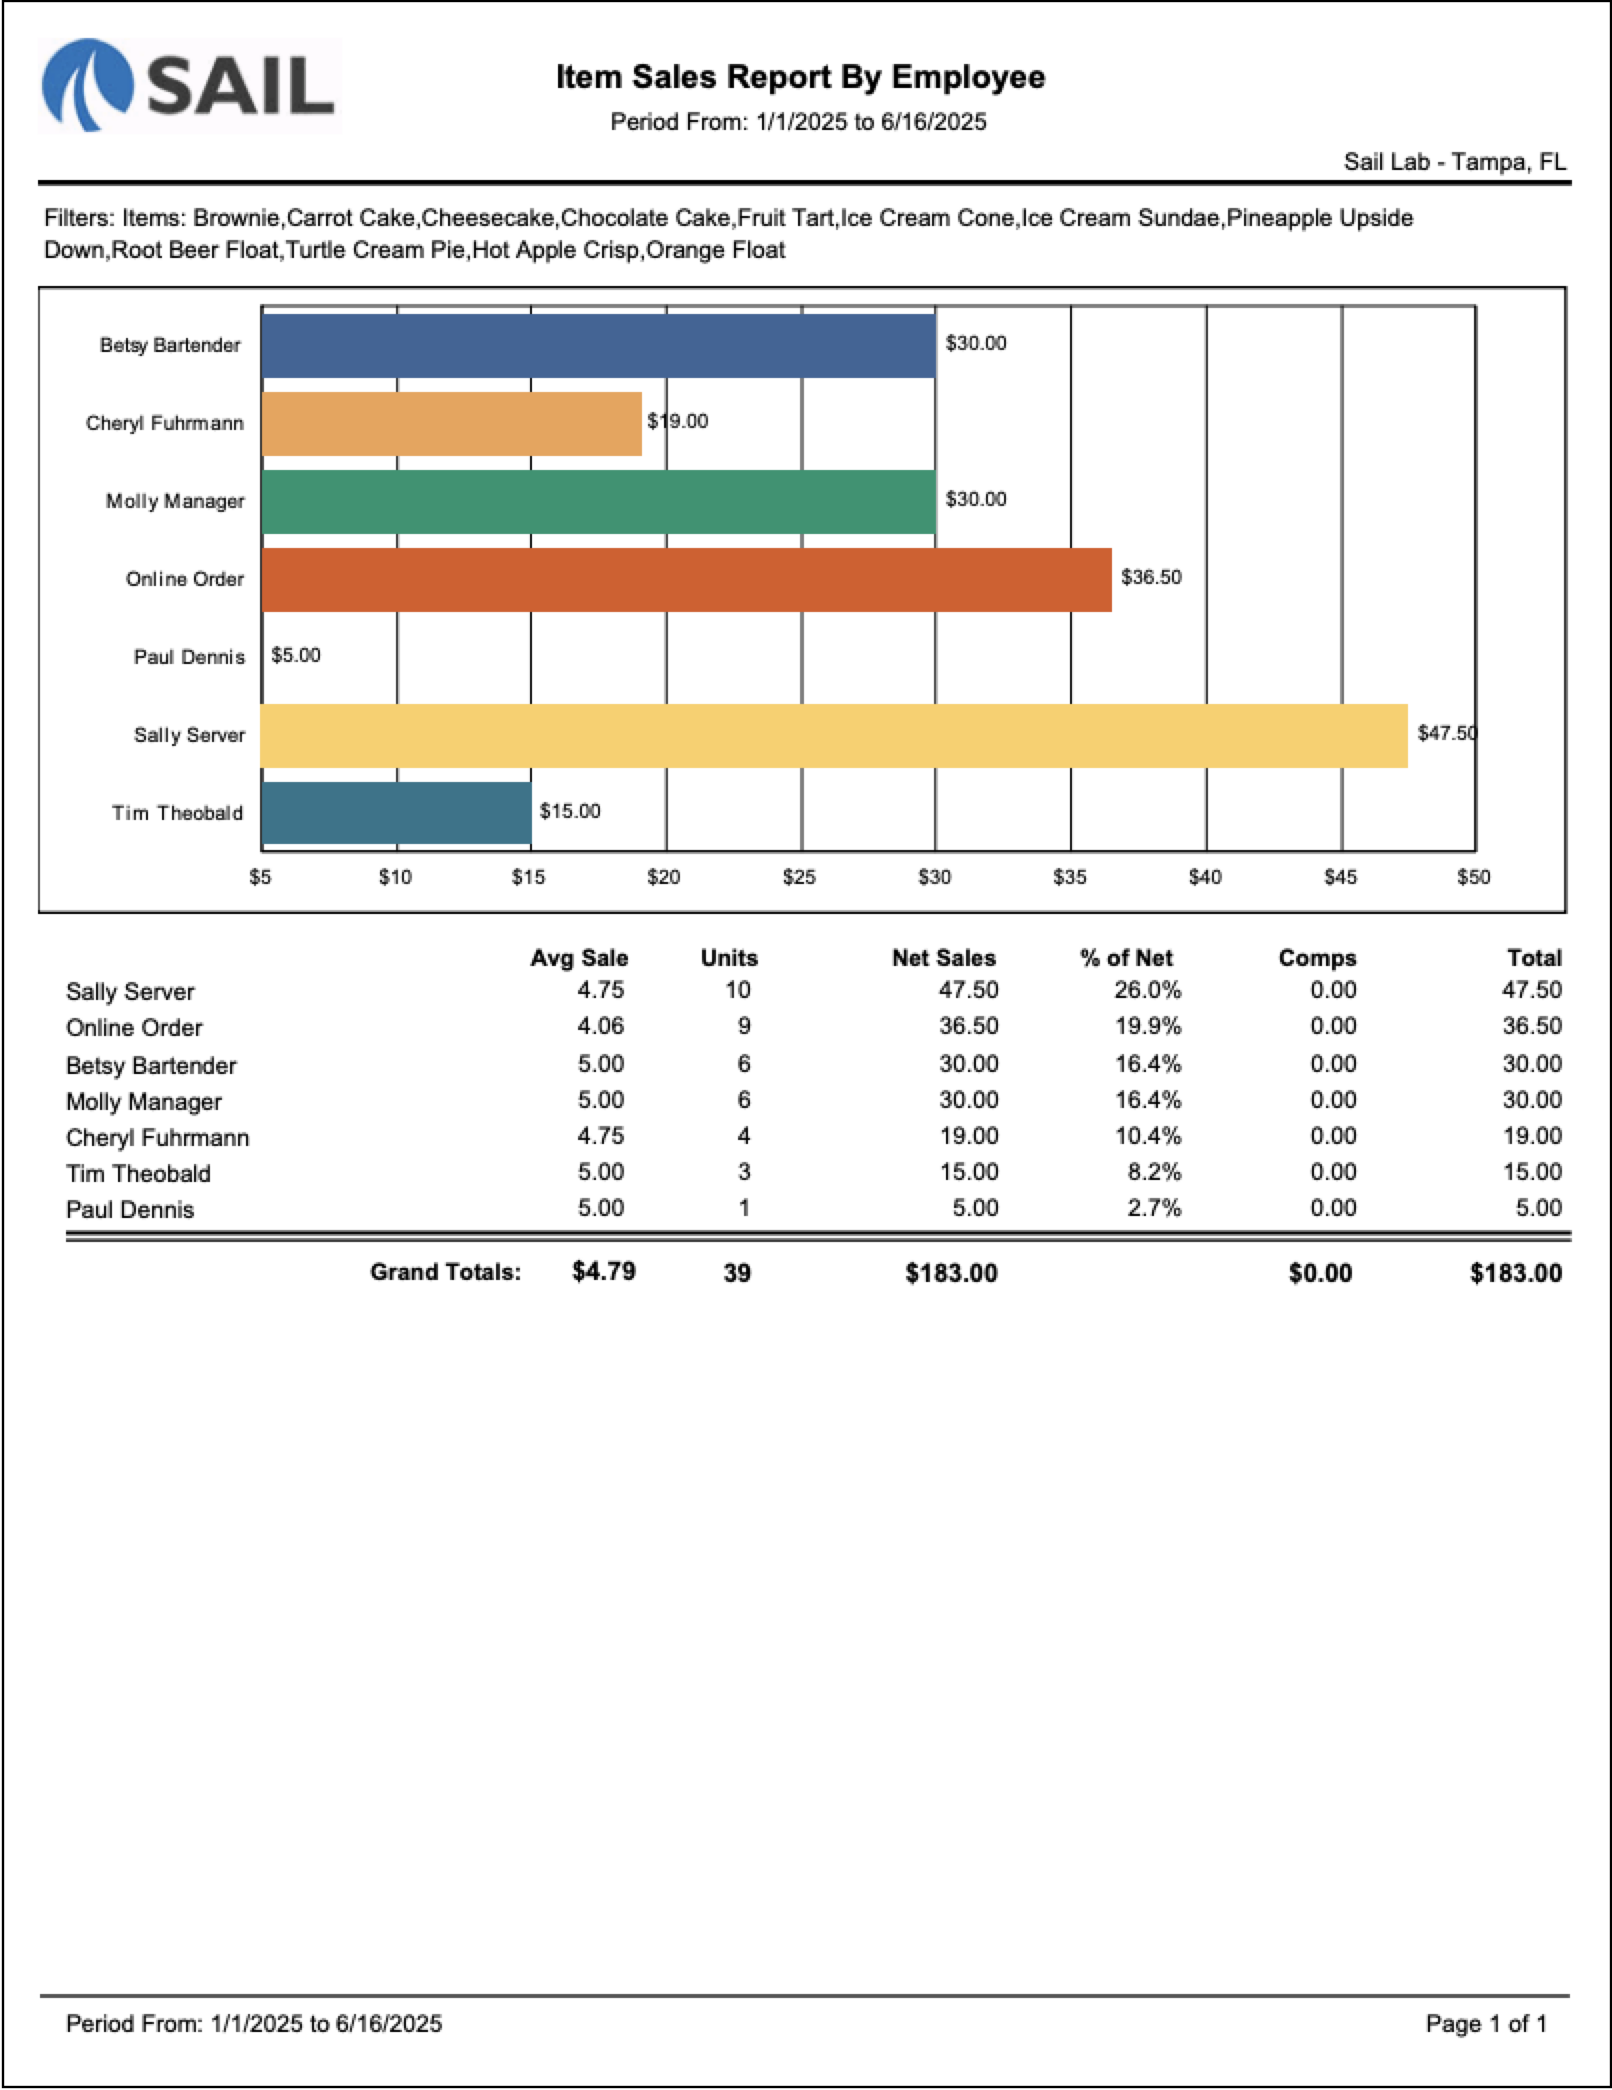
Example #1 - Grouped by Employee (with Chart)
-
Shows each employee’s total sales, with a bar chart for quick comparison.
-
Best when you’re running a contest for overall units sold or overall sales by person.
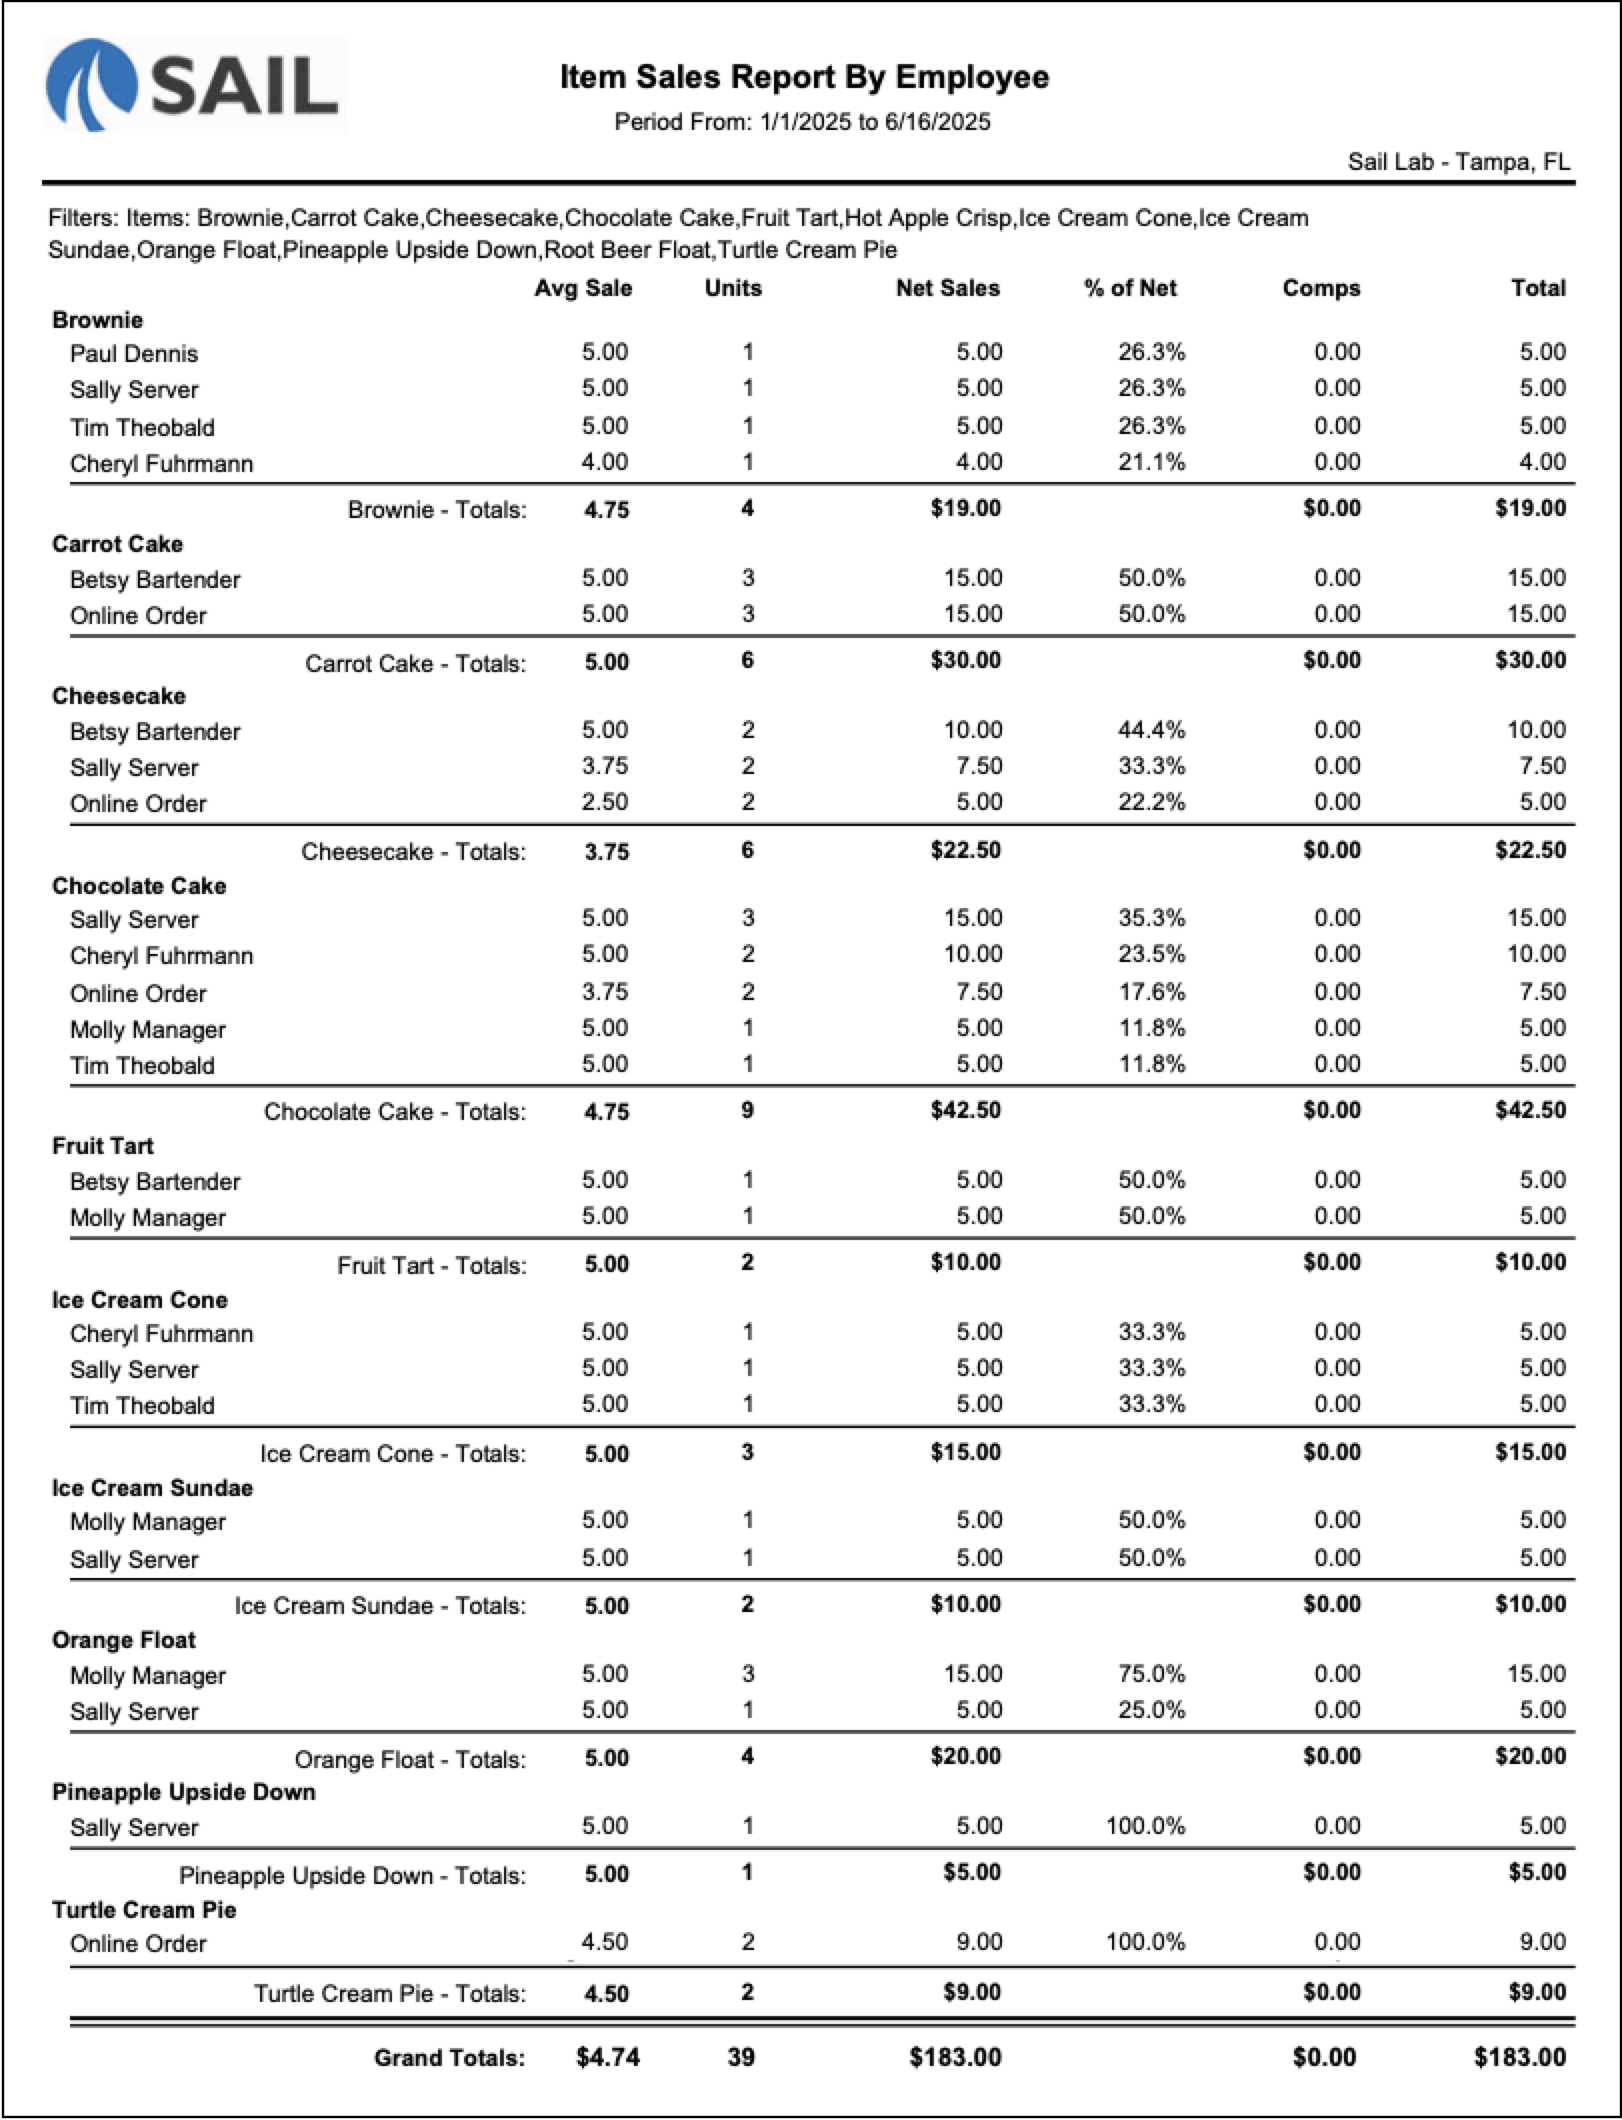
Example #2 - Grouped by Item
-
Breaks out sales by individual menu item, then shows employees under each.
-
Best when you want to know who sold the most of a specific item (e.g., brownies vs. cheesecake).
Report Parts
Column Descriptions
-
Avg Sale – Average dollar value of each sale (Net Sales ÷ Units).
-
Units – Number of items sold.
-
Net Sales – Dollar value of items sold (after discounts).
-
% of Net – Percentage of total sales represented by that employee/item.
-
Comps – Amount of sales comped (if any).
-
Total – Net Sales + Comps (represents full sales before comps).
How to Use This Report
-
Contests: Run this report to see which employee sold the most of a category (like desserts or drinks) during a contest period.
-
Performance: Compare sales volume (units sold) vs. revenue (net sales) — useful since the highest number of items sold isn’t always the same as the highest dollar amount.
-
Flexibility: Choose whether to view the information grouped by employee, item, or location, depending on the type of contest or analysis you’re running.
Tips for Using This Report
-
Set clear contest rules – Decide in advance whether the contest is based on Units Sold or Net Sales, since the winner could change depending on item prices.
-
Use Item Filters for speed – If you run the same contest often (like desserts), create an Item Filter so you don’t have to re-select items every time.
-
Turn on the chart for quick visuals – The optional bar chart makes it easy to see at a glance who’s in the lead.
-
Group by Item for fairness – If you want to compare sales of specific items (like cheesecakes vs. brownies), group by item instead of employee.
-
Group by Location for multi-store contests – Use the “Location” option to compare different stores and their employees in one report.
-
Track progress mid-contest – Run the report partway through the contest so employees can see where they stand and stay motivated.
No Comments