
Product Mix by Store Report
The Product Mix by Store Report compares item sales across multiple store locations within the selected date range.
It’s designed to help multi-location operators identify performance differences, track top sellers at each site, and confirm that menu consistency and pricing are aligned.
Where to find the report
- Backoffice --> Reporting --> Reports --> Sales folder --> Product Mix by Store --> Select Date Range --> Execute
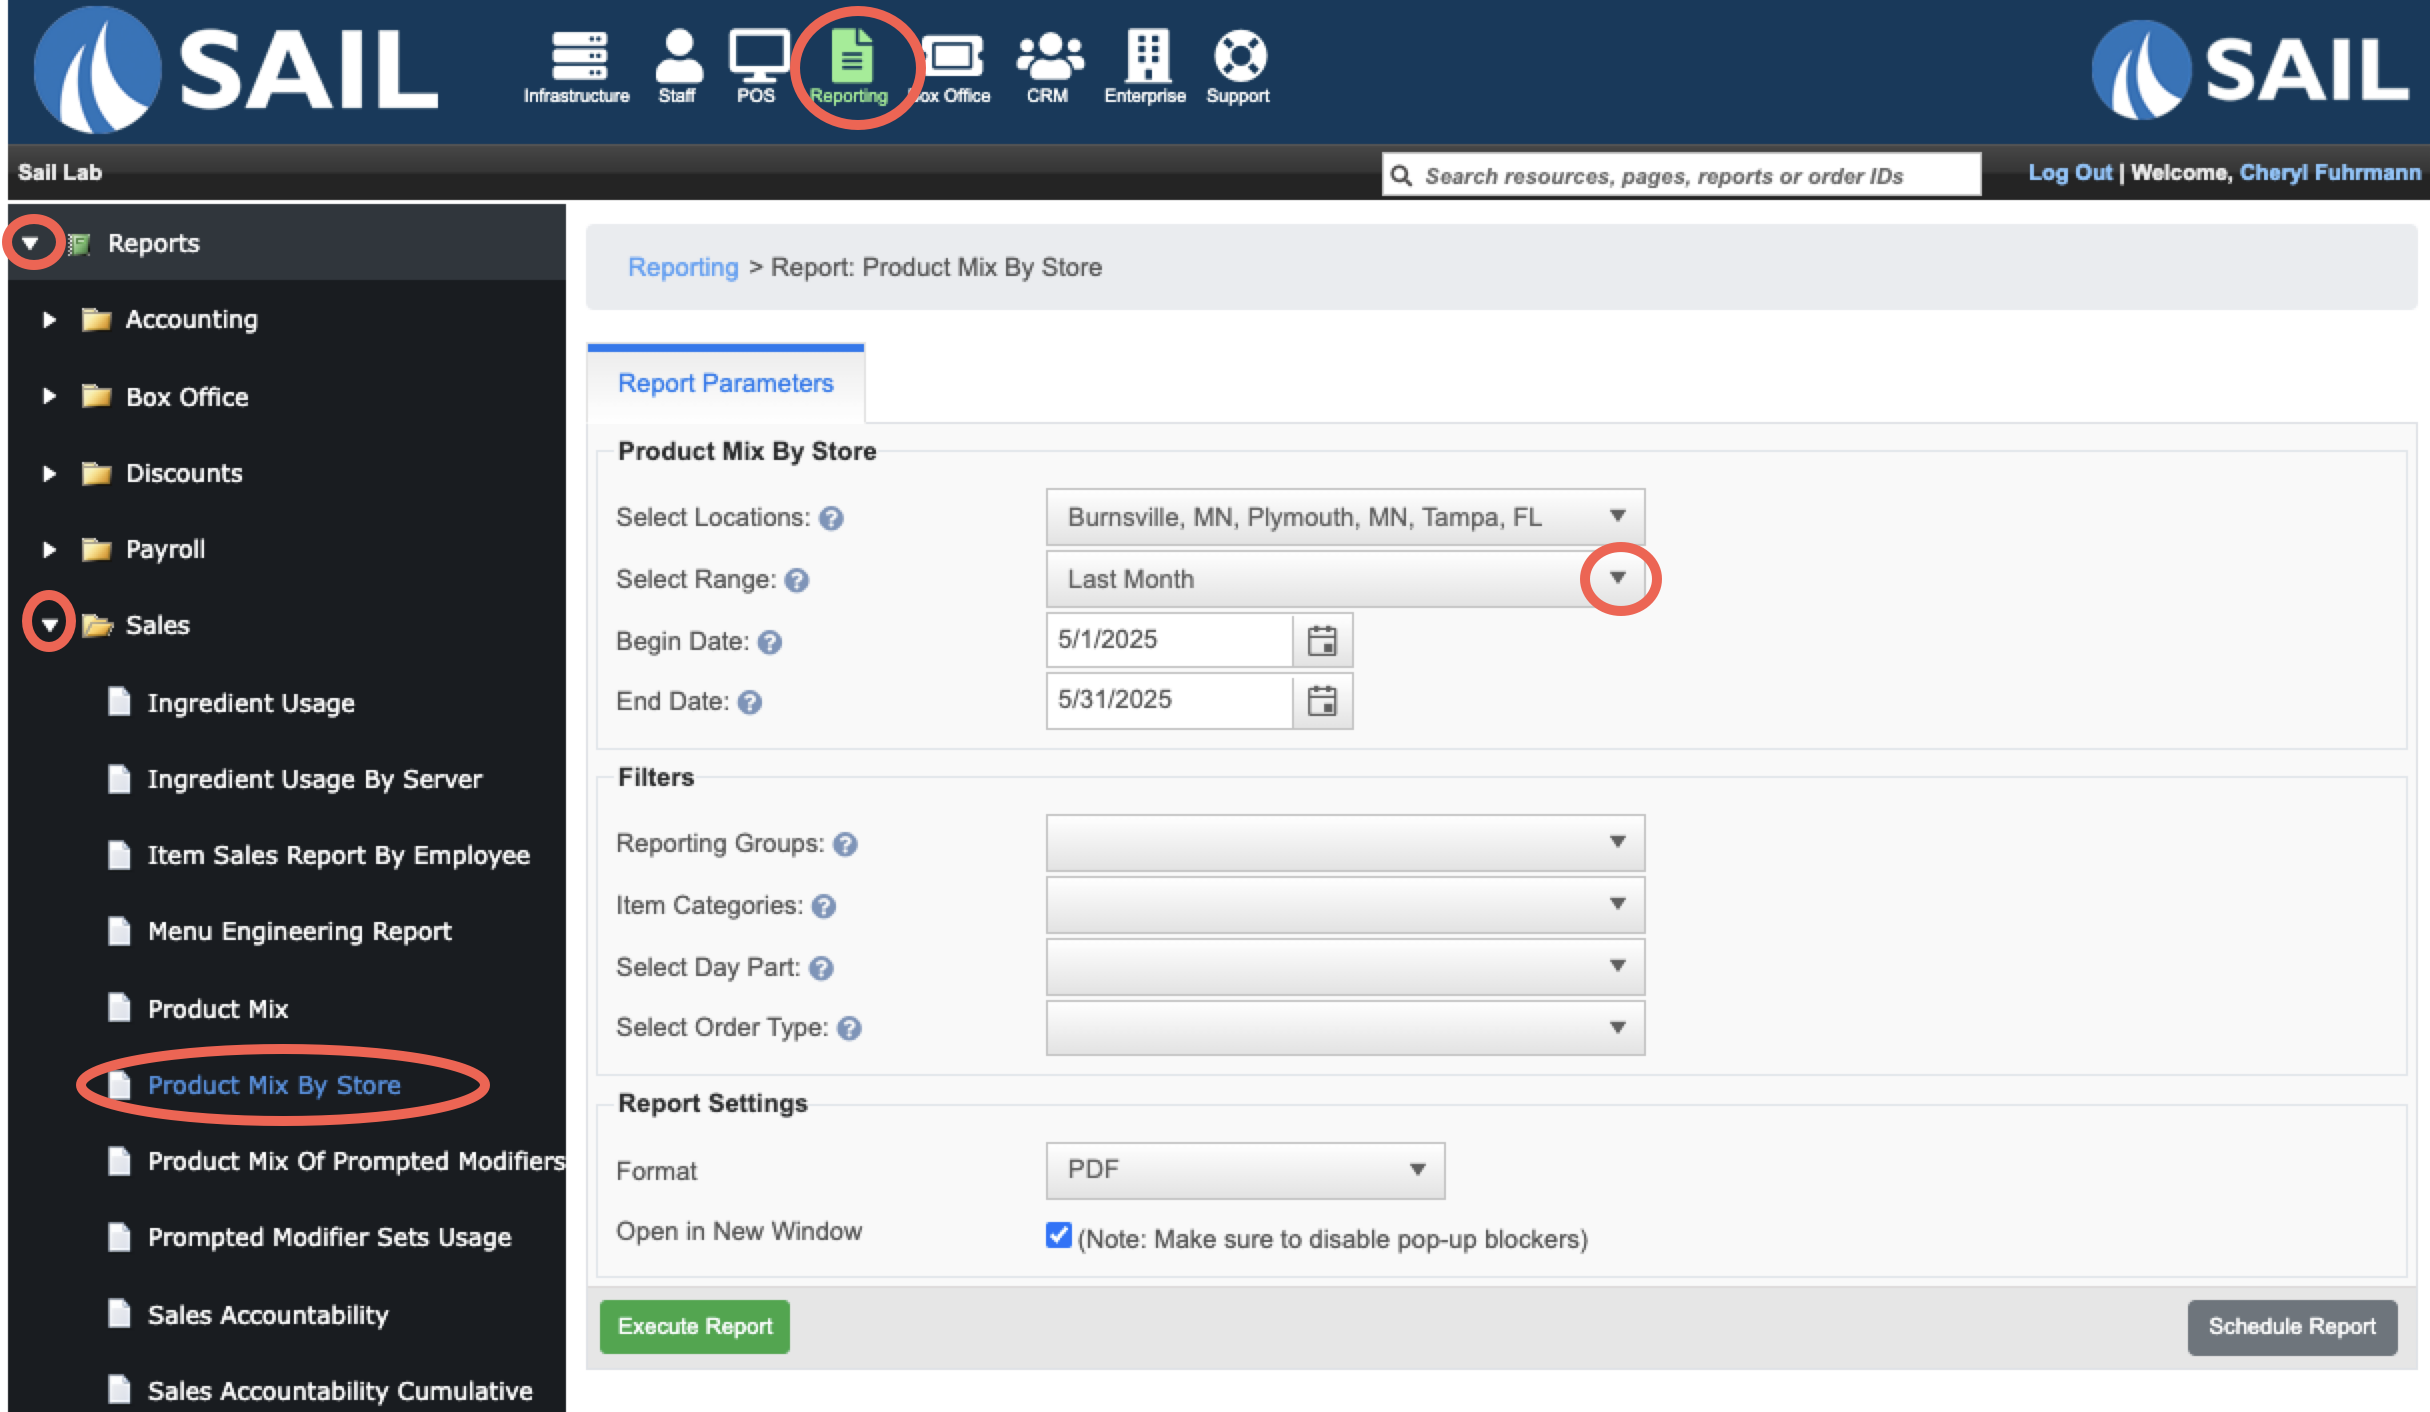
Report Options
Select Locations
- choose as many or as few locations
Filters
-
Reporting Groups – Filters the report by preconfigured groups (for example: “Food,” “Liquor,” or “Wine”).
These groups come from your menu setup and help narrow the results to only items within that group. -
Item Categories – Lets you filter by the Backoffice category assigned to each menu item (for example: “Appetizers,” “Entrees,” “Pizza,” etc.).
-
Select Day Part – Runs the report for a specific time block, such as Lunch, Dinner, or Late Night.
Day Parts are preconfigured in Backoffice and can vary by location. -
Select Order Type – Filters by order types like Dine In, To-Go, Delivery, or Online Order.
Useful if you want to see how modifier usage differs by service style.
What it looks like
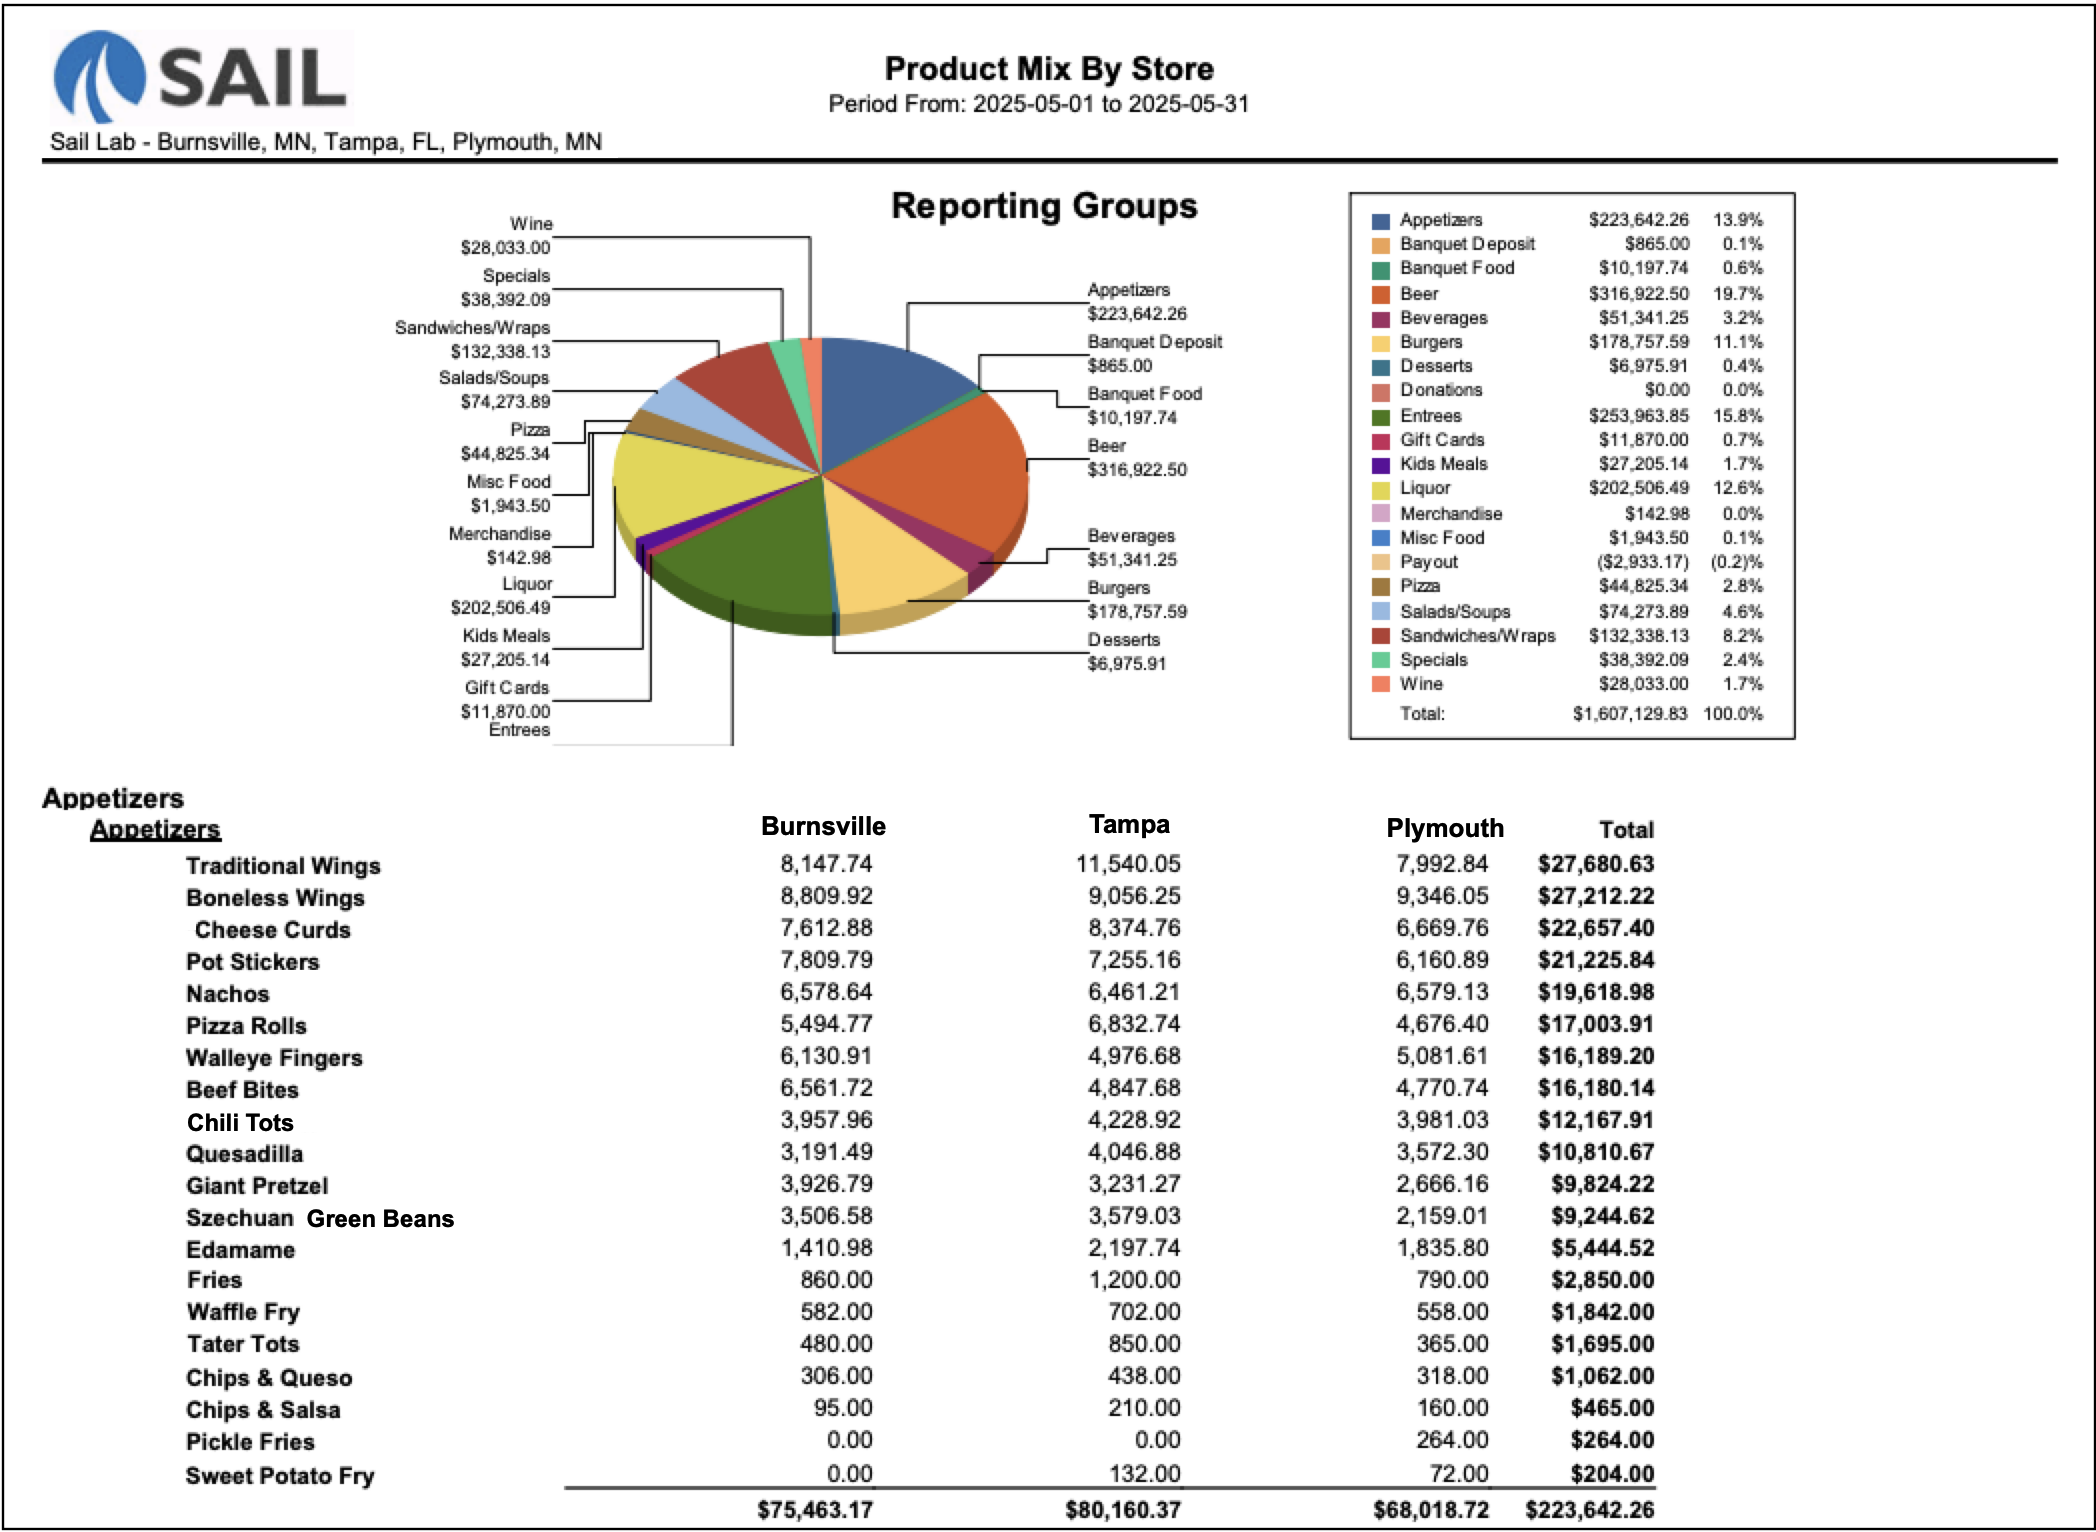
Report Parts
Pie Chart
- Displays total sales by Reporting Group as a visual breakdown of where revenue is coming from.
Organization / Sections
The report is organized in three layers:
- Reporting Group – Listed alphabetically (e.g., Food, Liquor, Beer).
- Category – Each Reporting Group is divided into its assigned categories (e.g., Burgers, Sandwiches, Desserts).
- Item – Items within each category are listed in order of how frequently they were sold during the selected date range.
- Category – Each Reporting Group is divided into its assigned categories (e.g., Burgers, Sandwiches, Desserts).
This report does not display modifier information—only base menu items.
Columns
Subtotals
-
Category Totals: Sum all items within each category across stores.
How to Use This Report
-
Compare sales performance of the same items across different stores to identify regional or operational differences.
-
Review total sales by Reporting Group using the pie chart to see which categories drive the most revenue.
-
Spot menu inconsistencies or missing items if one store doesn’t show sales for an item available elsewhere.
-
Use the data to balance inventory or adjust menu focus based on local demand.
-
Validate pricing consistency across stores to ensure all locations are aligned.
-
Identify underperforming categories or items at specific stores and investigate the cause (e.g., training, placement, or availability).
No Comments