
Void and Comp Summary Report
The Void and Comp Summary Report provides an overview of all voids and comps processed within a selected date range. It shows how many voids and comps occurred, the reasons recorded, the employees who applied them, and the total dollar impact. This report helps managers monitor losses, review staff activity, and identify areas that may need operational improvements.
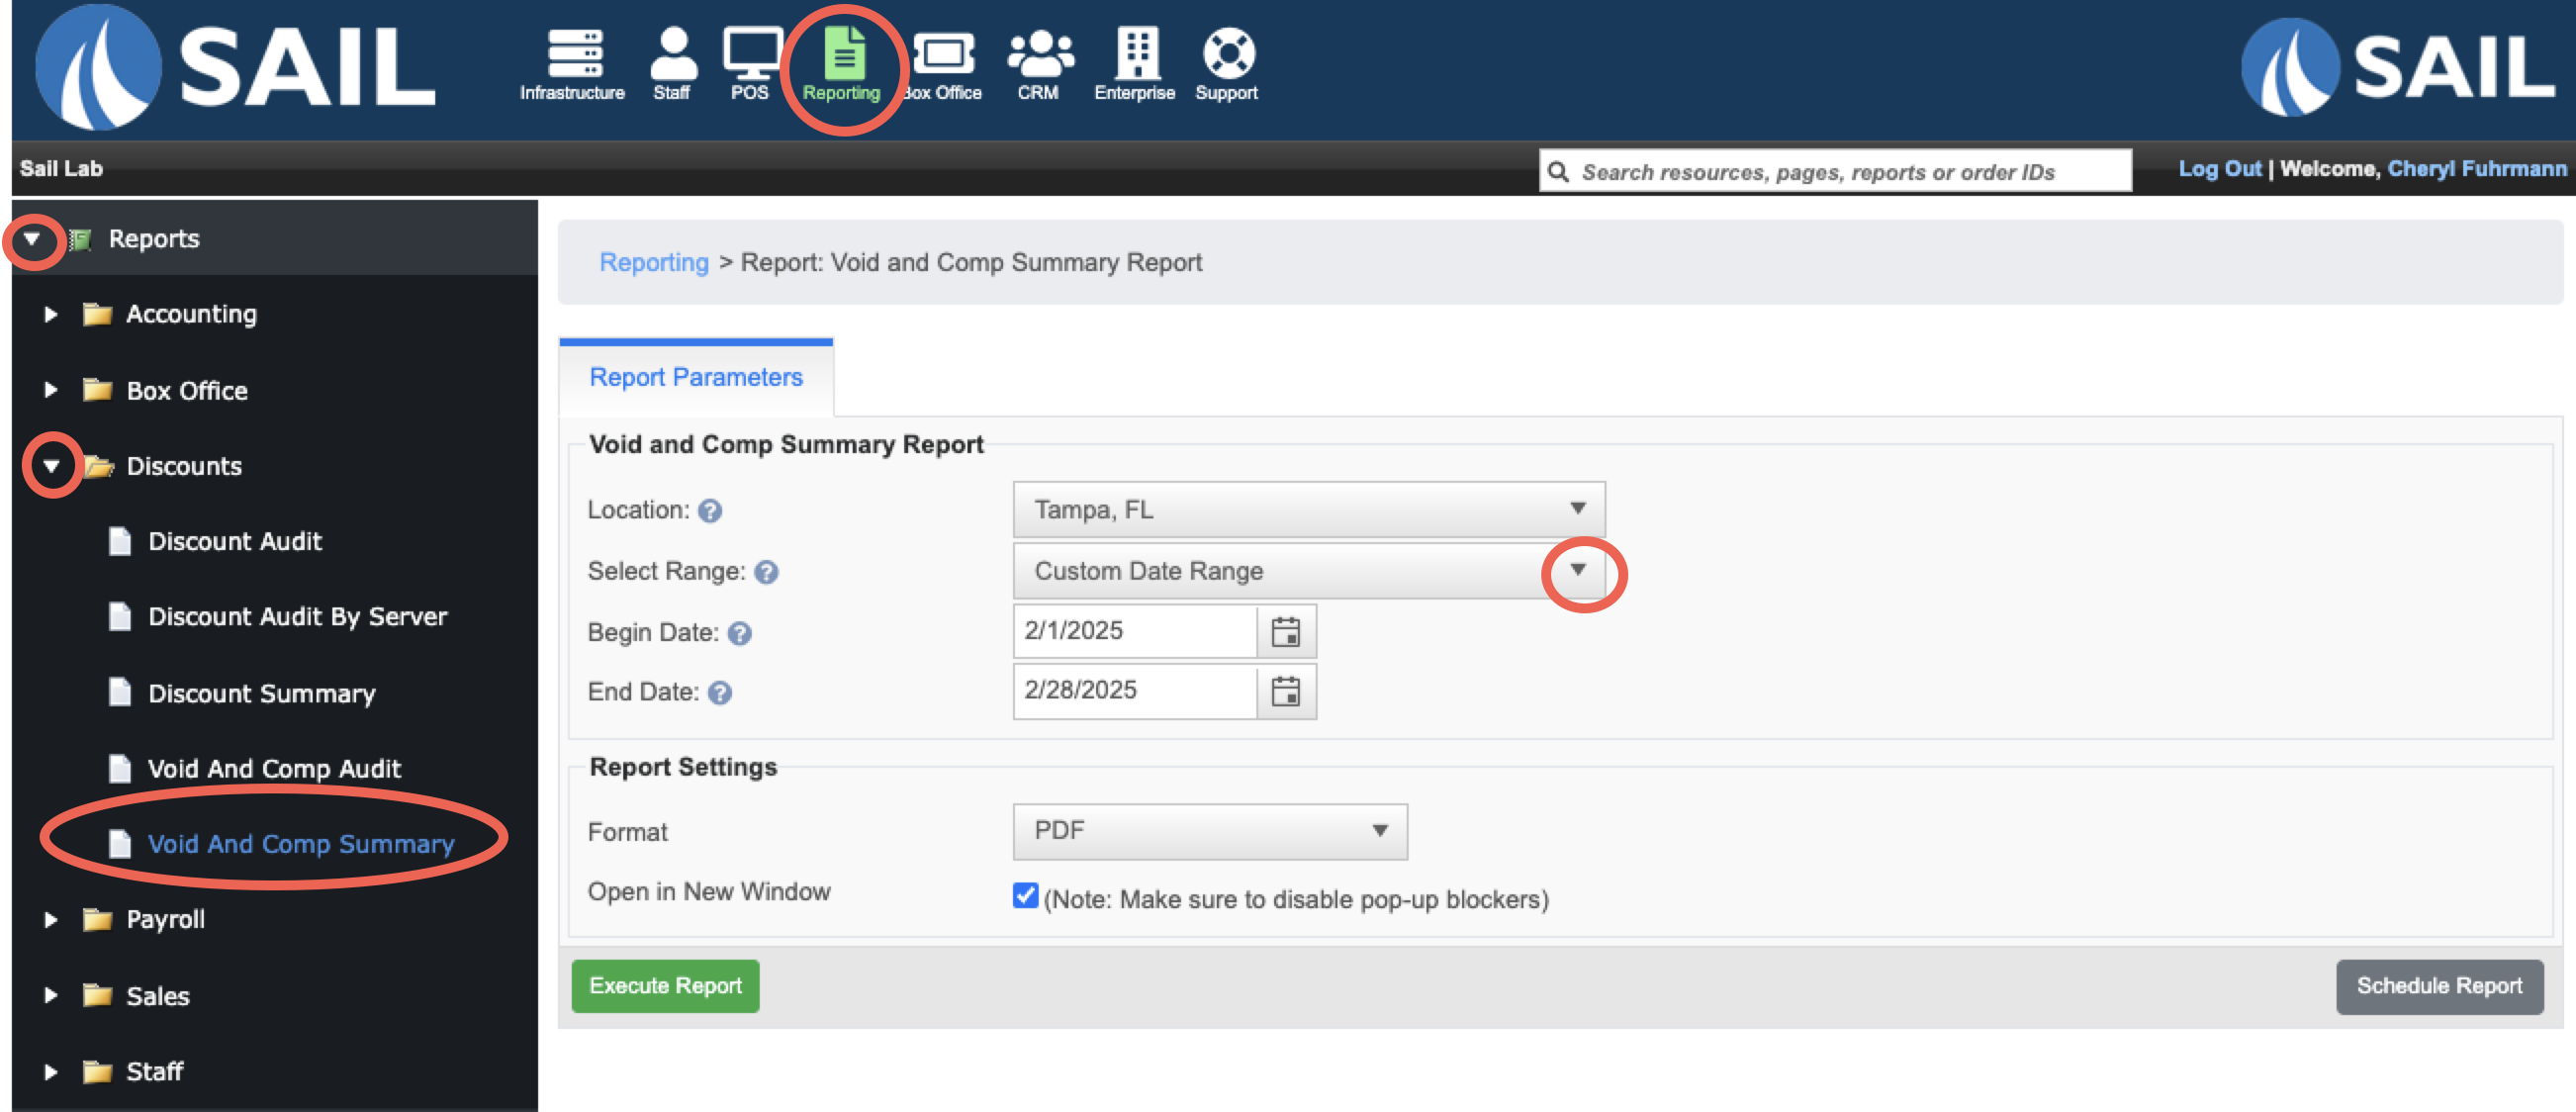
Where to find the report
- Backoffice --> Reporting --> Reports --> Discount folder --> Void and Comp Summary --> Select Date Range --> Execute
What it looks like
Report Parts
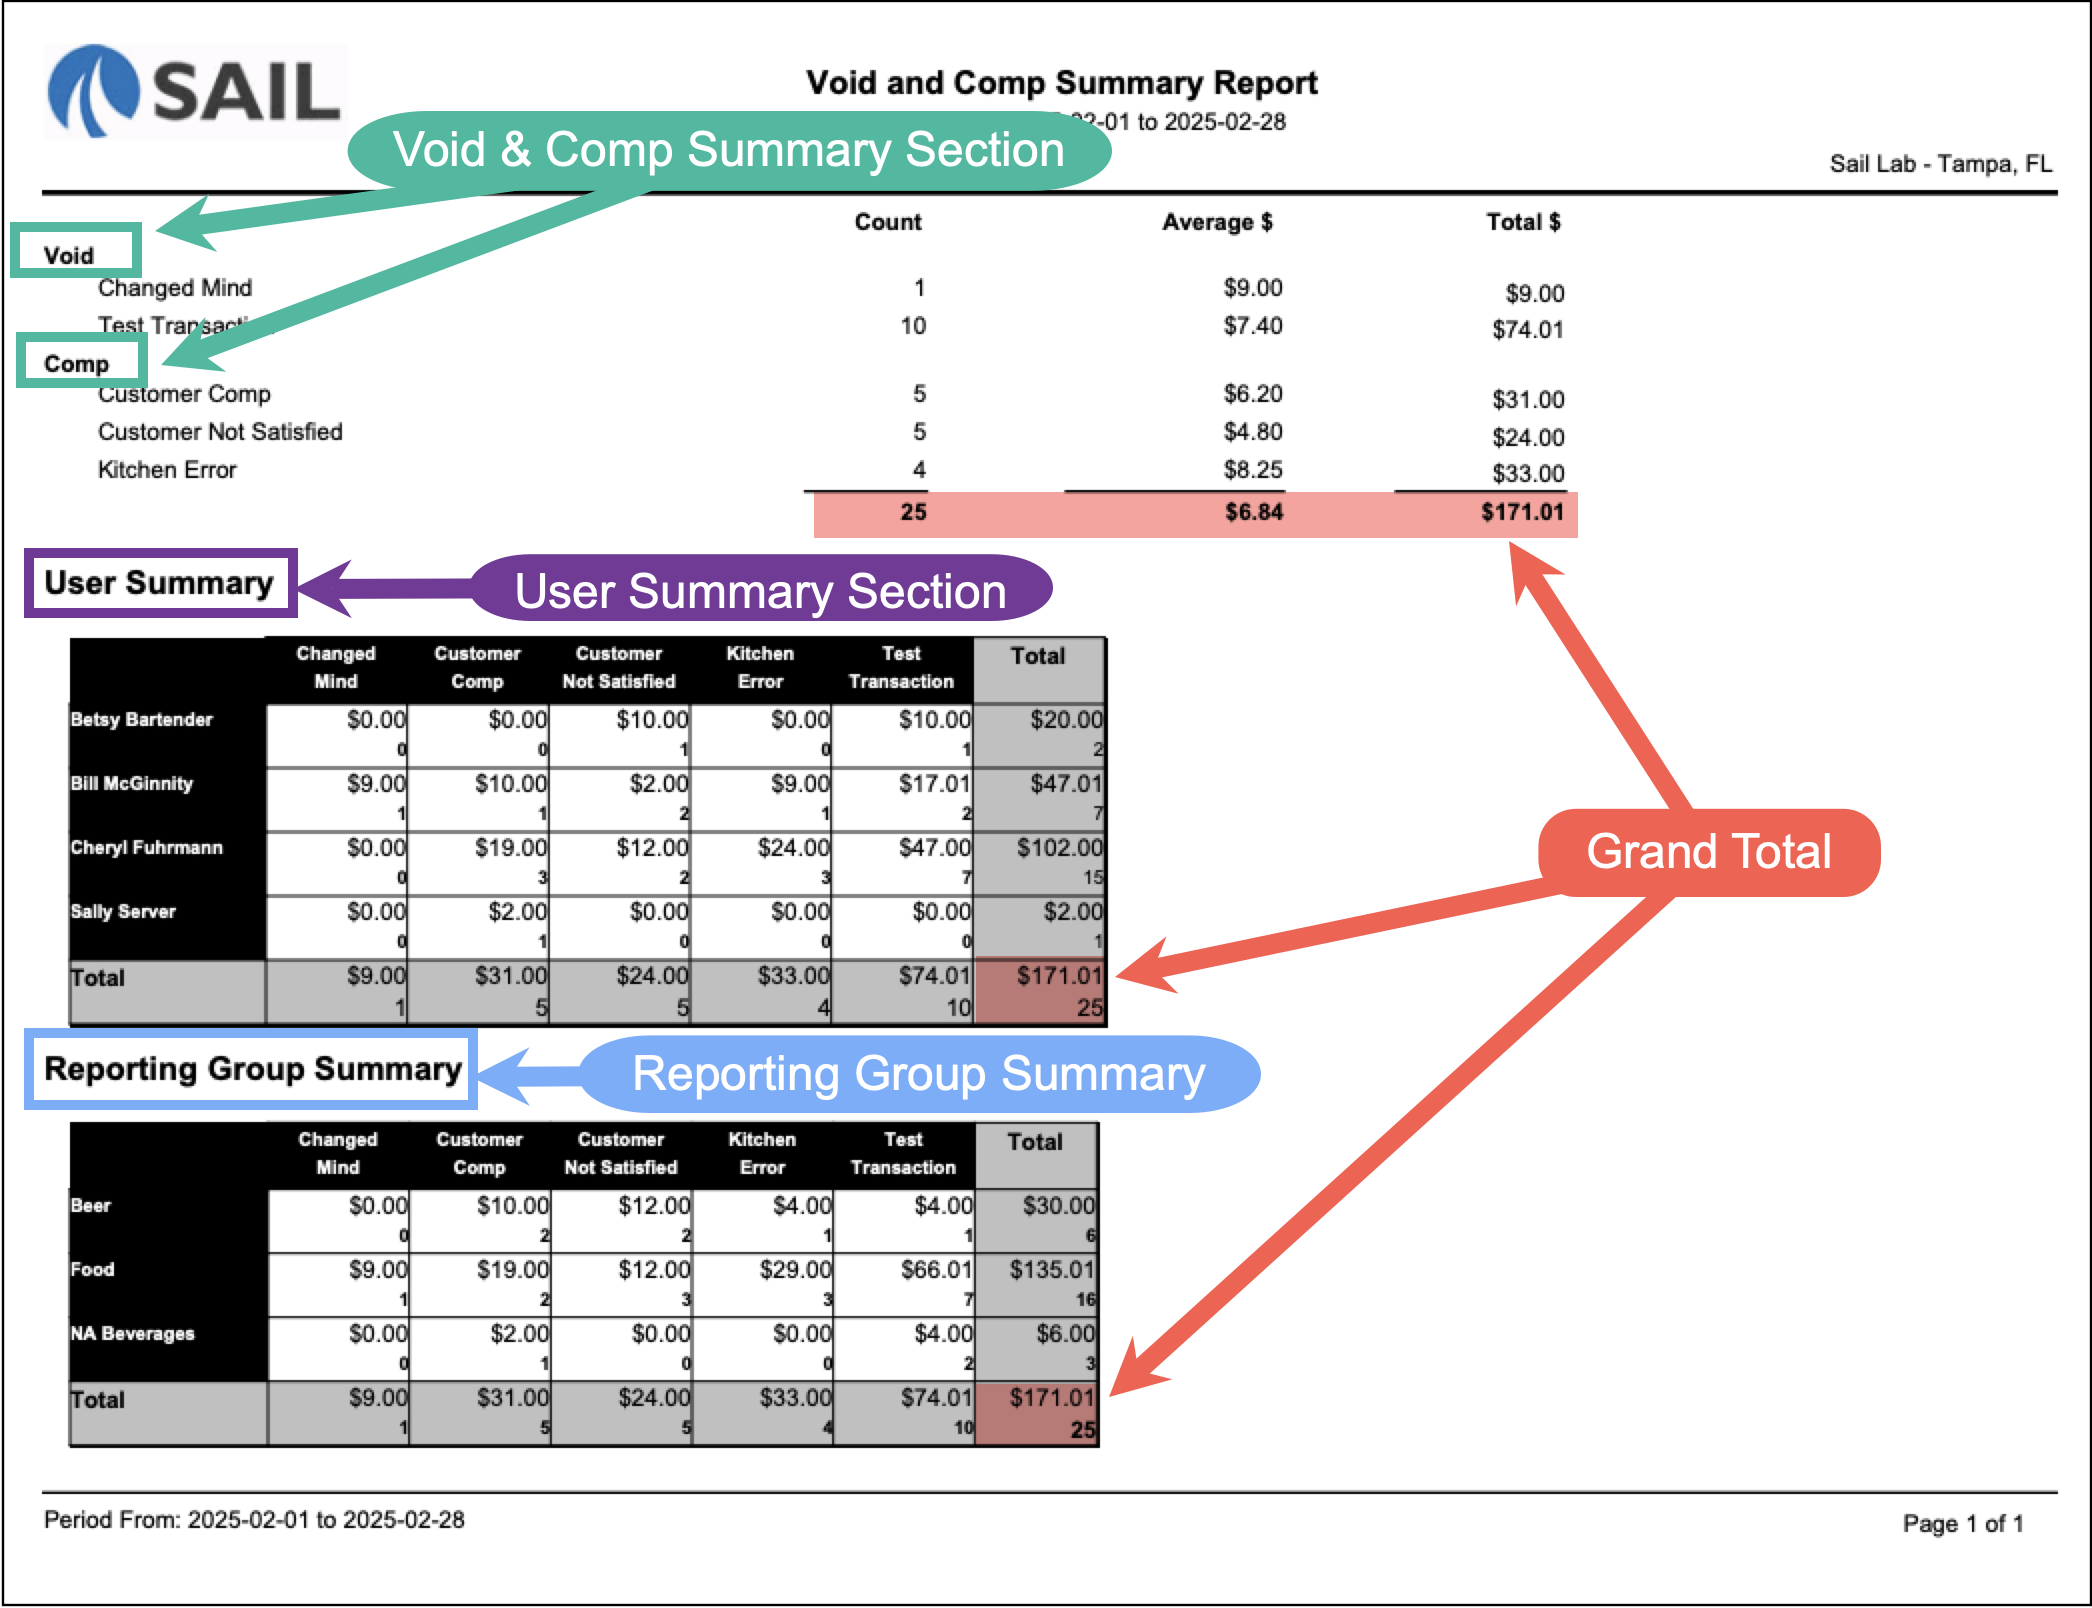
Summary Section
The top section breaks down each void or comp type.
Columns include:
-
Count – The number of times that void/comp reason was used.
-
Average $ – The average dollar value of that void/comp (calculated as Total $ ÷ Count).
-
Total $ – The total dollar value for that void/comp type.
At the bottom, the totals row shows:
-
Total Count – The total number of voids and comps.
-
Overall Average $ – The average value across all voids and comps. (calculated as Grand Total $ ÷ Total Count).
-
Grand Total $ – The combined total value of all voids and comps.
User Summary
The User Summary table breaks down voids and comps by employee.
-
Rows = Employees.
-
Columns = Void/Comp reasons.
-
Intersections = Dollar value of voids/comps that employee applied under that reason.
-
Totals Column – The total dollar value of voids/comps applied by each employee.
-
Bottom Row Totals – Totals for each reason across all employees.
Note: Voids and comps are permissions-based functions. The employees listed here reflect those who have been granted rights to perform these actions. If unexpected names appear, it may indicate that your permission settings should be reviewed.
Reporting Group Summary
The Reporting Group Summary organizes voids and comps by the preconfigured reporting groups that you created in your system (for example: Beer, Food, Non-Alcoholic Beverages).
-
Rows = Reporting groups.
-
Columns = Void/Comp reasons.
-
Intersections = Dollar value of voids/comps in that group under that reason.
-
Totals Column – The total voids/comps for each reporting group.
-
Bottom Row Totals – Totals for each reason across all groups.
How to Use This Report
This report helps you:
-
Track the total financial impact of voids and comps.
-
Monitor which employees are applying the most voids/comps.
-
Identify reasons most frequently used and evaluate if they are valid.
-
Review trends by product group to pinpoint where issues are occurring (e.g., kitchen errors, guest satisfaction).
-
Detect unusual patterns that may indicate training needs or potential misuse.
No Comments