
Labor Percent Report
The Labor Percent Report shows the relationship between labor costs and sales for a selected date range. It breaks down hours and costs by job role, making it easy to track how much each department contributes to total labor cost and how labor compares to sales.
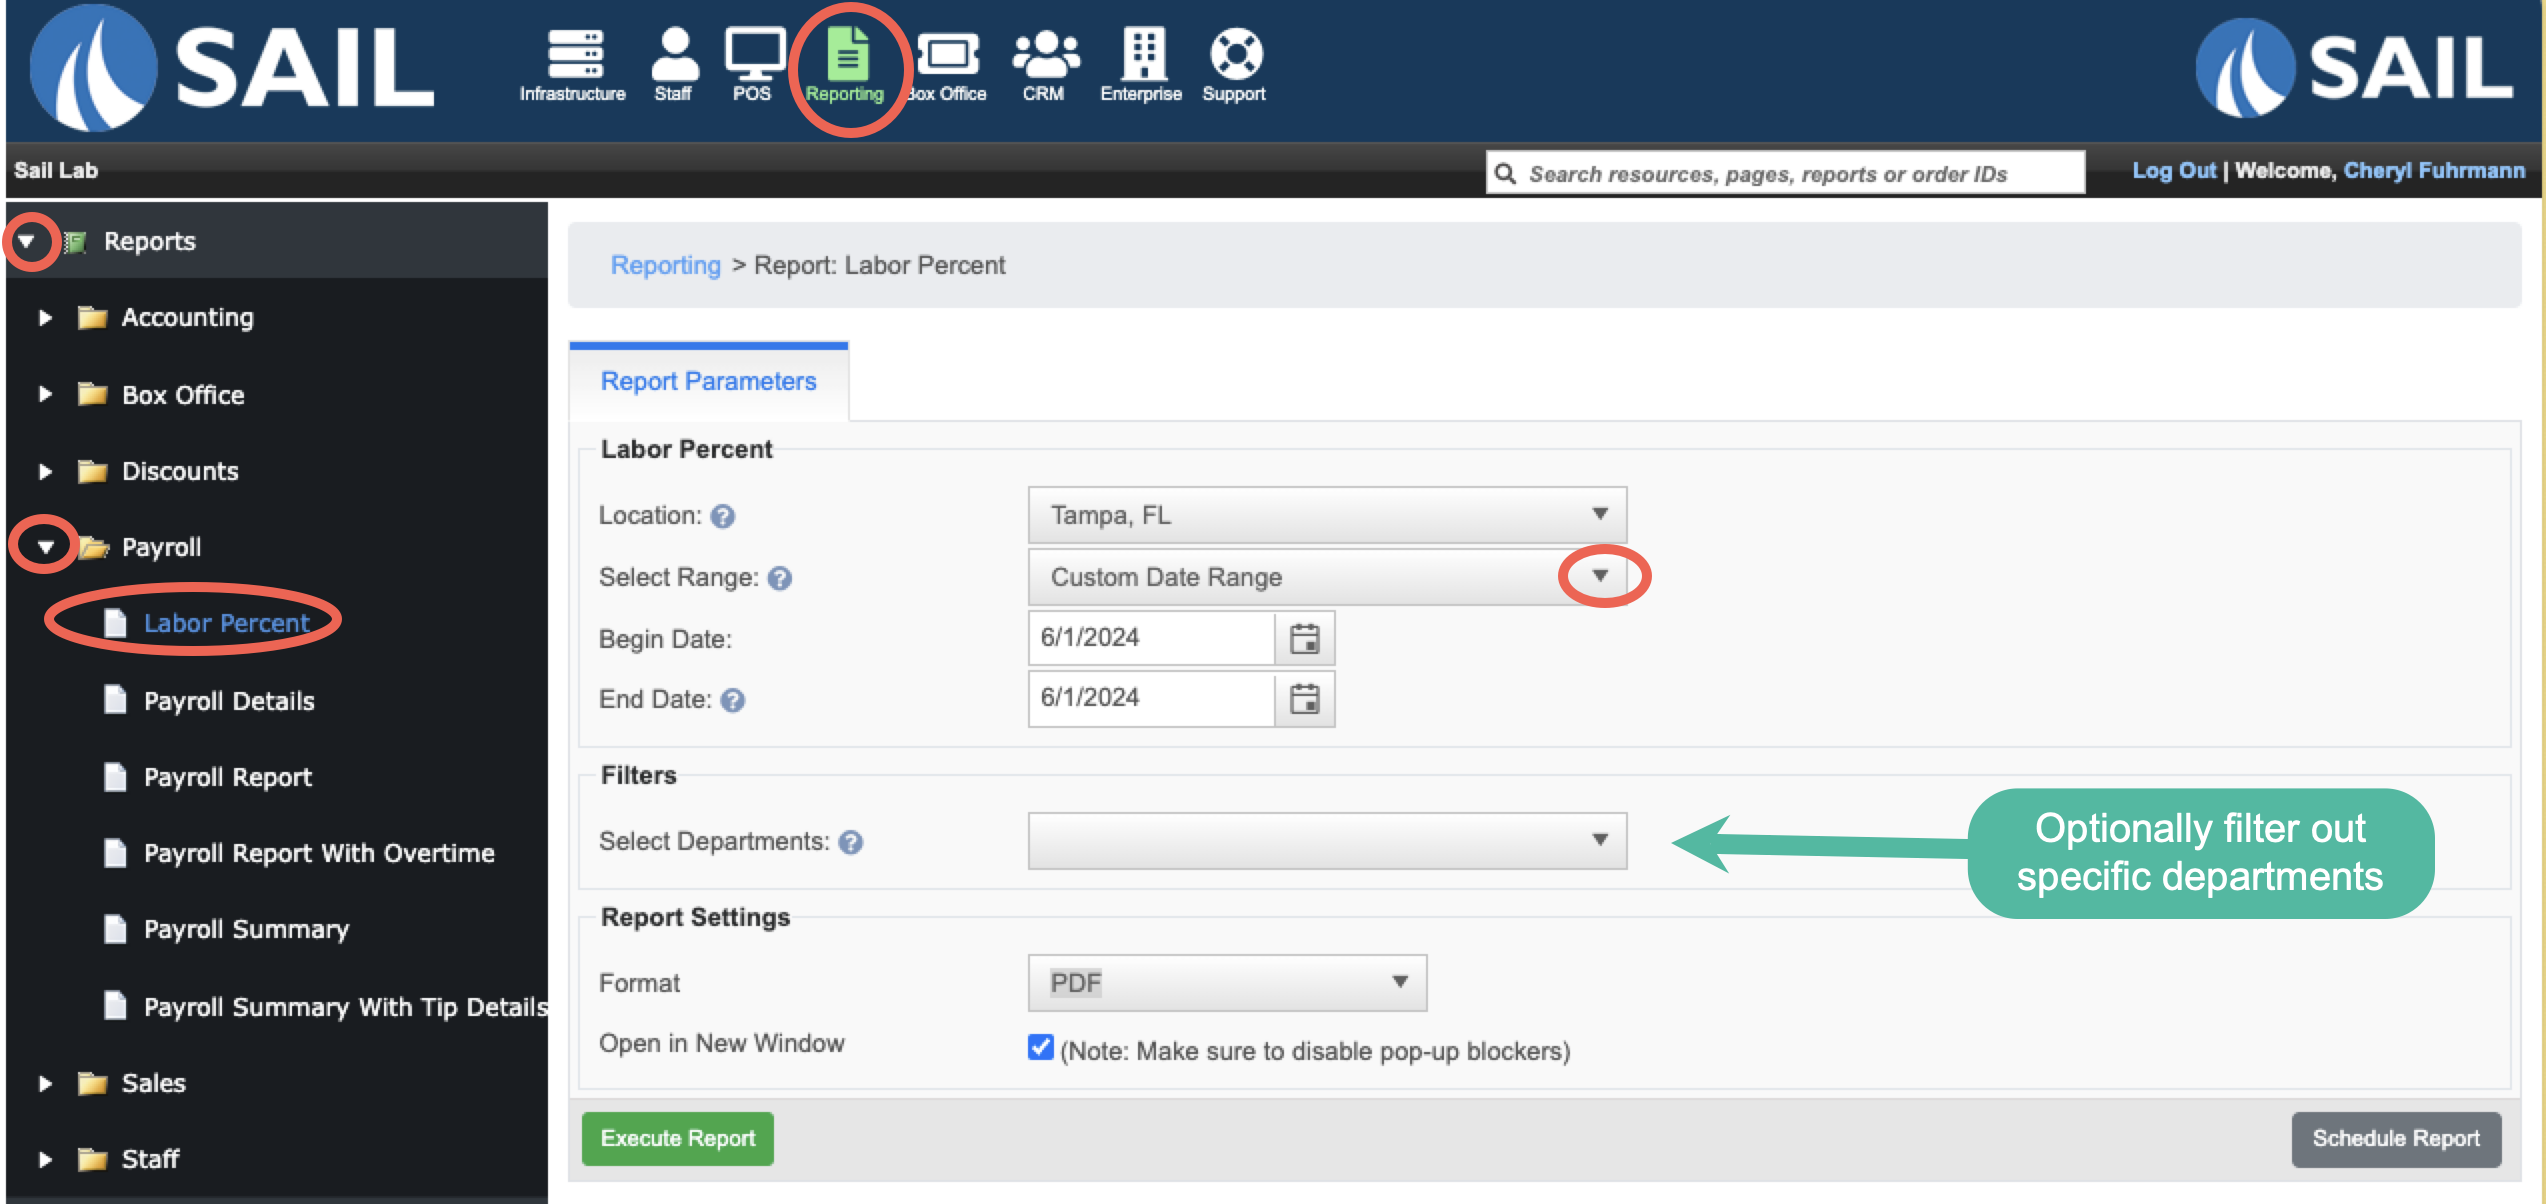
Where to find the report
- Backoffice --> Reporting --> Reports --> Payroll folder --> Labor Percent --> Select Date Range --> Execute
Report Options
Filters
-
Departments – Allows you to run the report for specific departments instead of all employees.
What it looks like
Report Parts
Report Structure
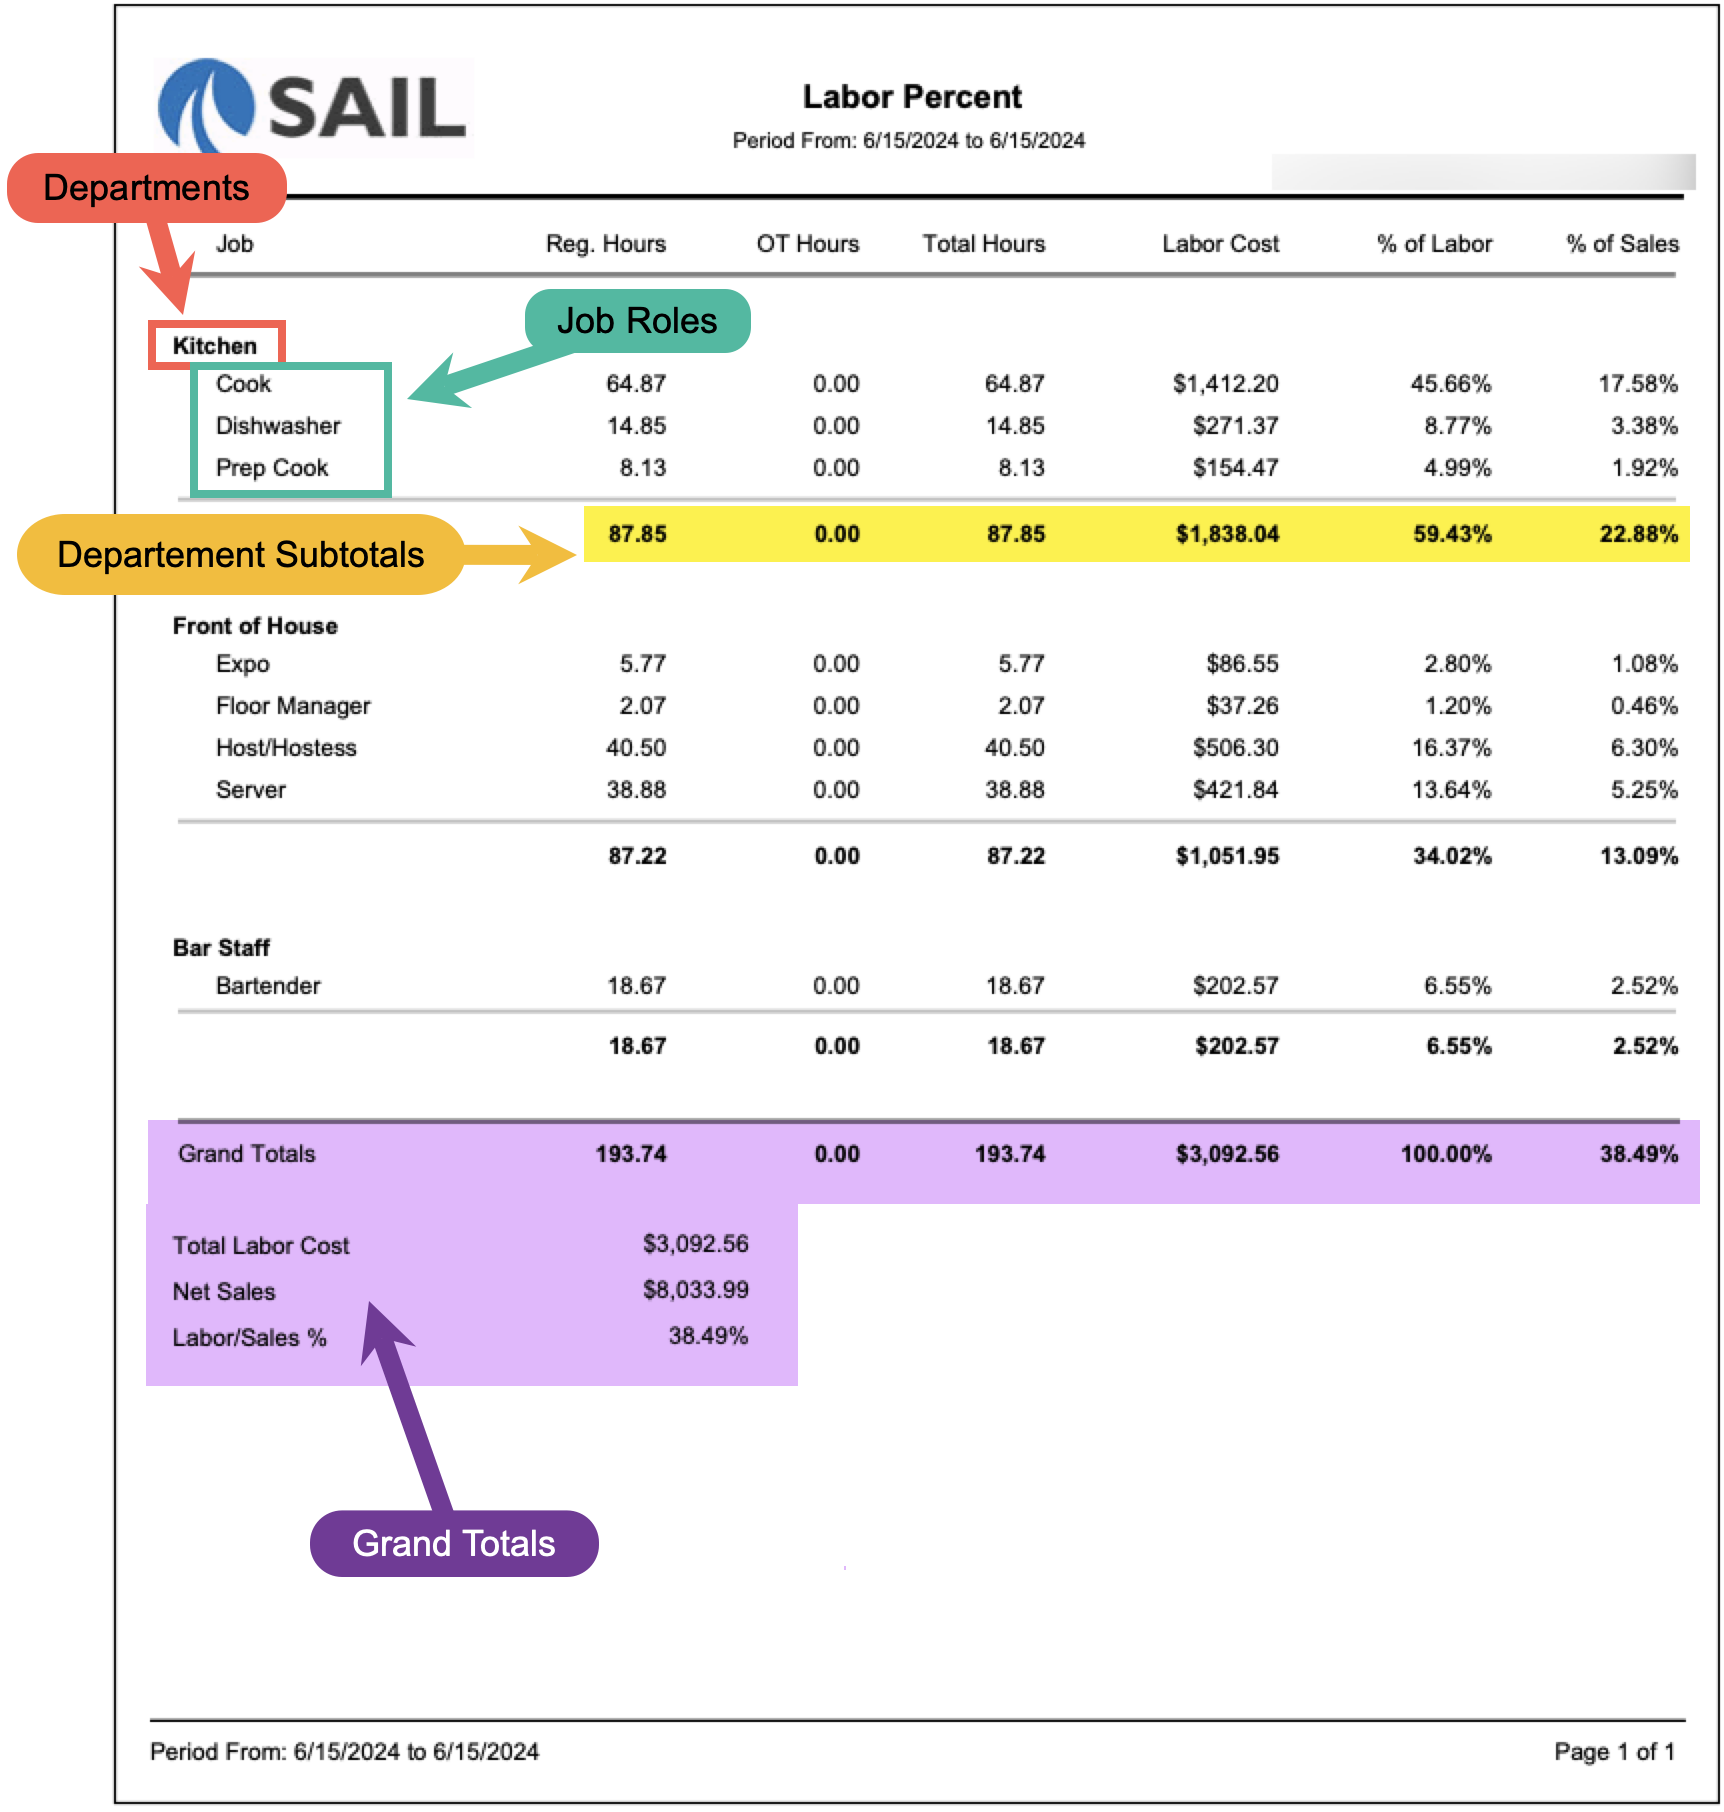
The report is grouped by department (e.g., Kitchen, Front of House, Bar Staff). Under each department, individual job roles are listed.
Here’s what each column means
-
Job – The employee role (e.g., Cook, Server, Bartender).
-
Reg. Hours – Regular hours worked.
-
OT Hours – Overtime hours worked.
-
Total Hours – Combined regular and overtime hours.
-
Labor Cost – Total cost of wages for that role.
-
% of Labor – The percentage of overall labor costs attributed to this role.
- How to calculate that number:
- The labor cost for that job ÷ Total Labor Cost (for all jobs)
Example: If Servers cost $421.84 and the Total Labor Cost is $3,092.56, then
$421.84 ÷ $3,092.56 = 13.64%
- The labor cost for that job ÷ Total Labor Cost (for all jobs)
- How to calculate that number:
-
% of Sales – The percentage of total sales covered by the labor for this role.
- How to calculate that number
- The labor cost for that job ÷ Net Sales
Example: If Servers cost $421.84 and Net Sales are $8,033.99, then
$421.84 ÷ $8,033.99 = 5.25%
- The labor cost for that job ÷ Net Sales
- How to calculate that number
Each department ends with a subtotal for all roles in that group.
Grand Totals
At the bottom of the report, you’ll see:
-
Grand Totals – The sum of all hours and labor costs across all roles.
-
Total Labor Cost – The total dollar amount spent on labor during the reporting period.
-
Net Sales – The total net sales for the same period.
-
Labor/Sales % – The ratio of labor cost to sales, expressed as a percentage.
-
Labor/Sales % – Total Labor Cost ÷ Net Sales.
-
Example: $3,092.56 ÷ $8,033.99 = 38.49%
- So, for every $1.00 in sales, about $0.38 was spent on labor.
-
-
How to Use This Report
This report helps you:
-
Track how much labor each department contributes to overall costs.
-
Compare labor distribution across job roles.
-
Measure the percentage of sales spent on labor to evaluate efficiency.
-
Identify departments with unusually high labor-to-sales ratios.
-
Monitor overtime usage and its impact on overall costs.
No Comments